Clinical Trial
. 2015 Feb 19;125(8):1207-16.
doi: 10.1182/blood-2014-10-603100. Epub 2014 Dec 5.

BRAF inhibitors reverse the unique molecular signature and phenotype of hairy cell leukemia and exert potent antileukemic activity

Affiliations
Clinical Trial

BRAF inhibitors reverse the unique molecular signature and phenotype of hairy cell leukemia and exert potent antileukemic activity

Valentina Pettirossi et al. Blood. .

Abstract

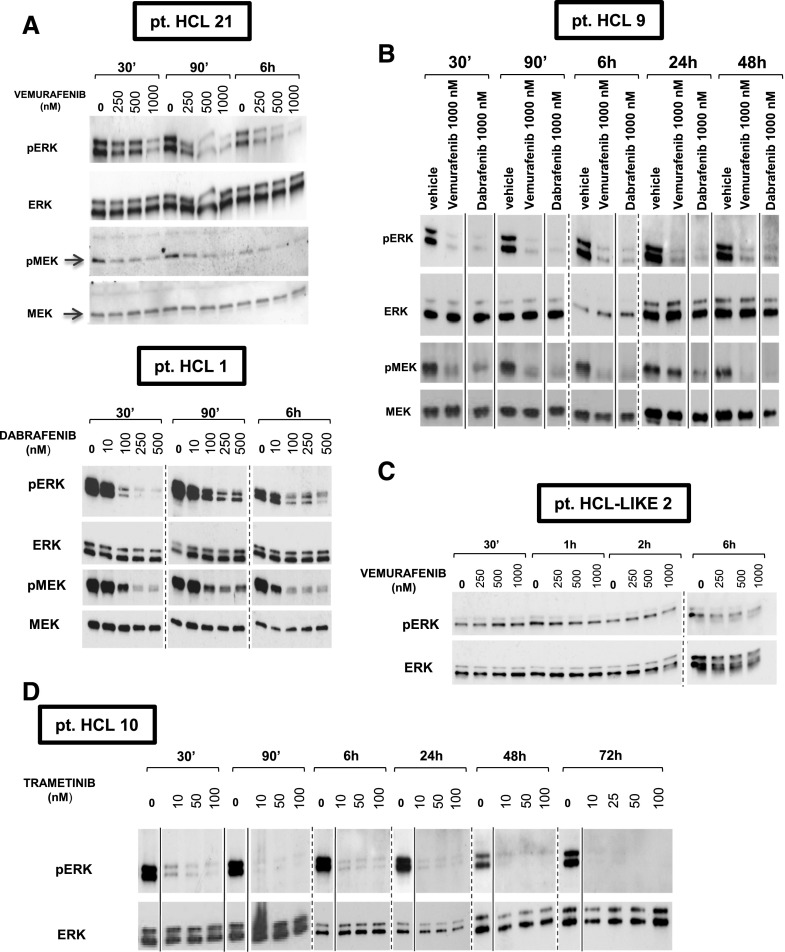
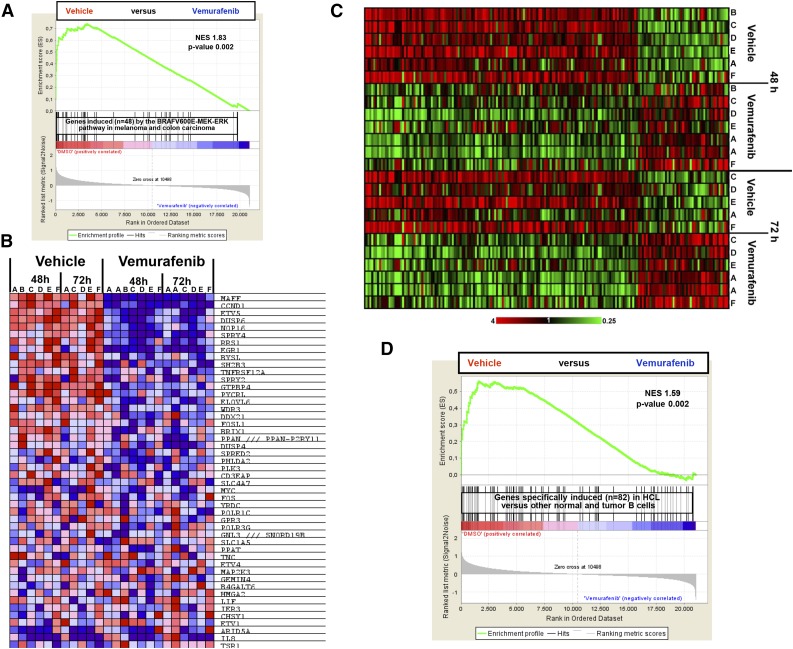
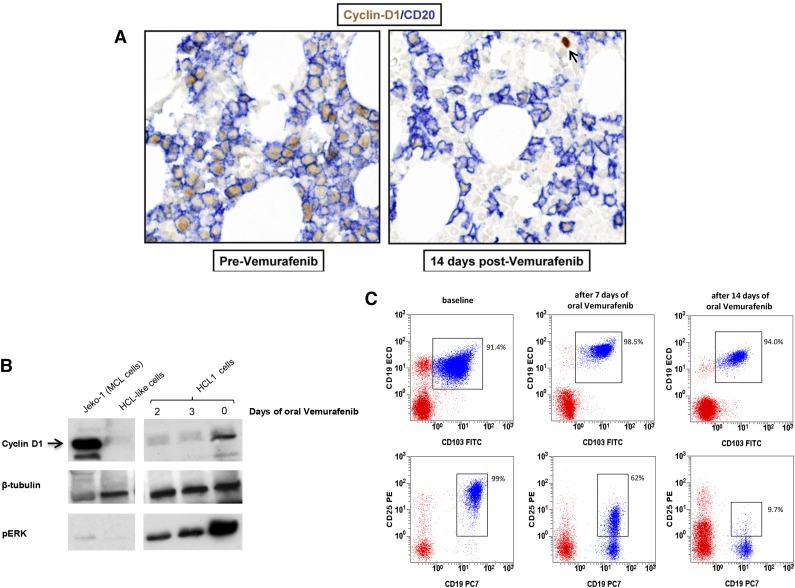
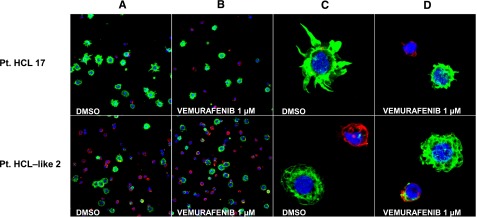
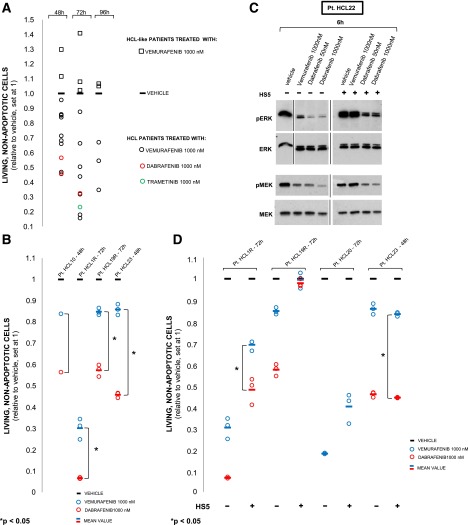
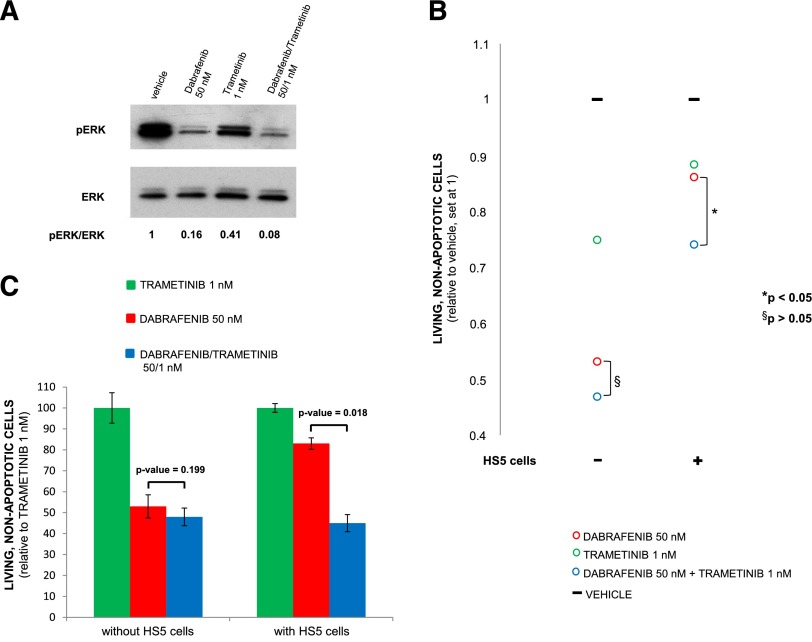
Hairy cell leukemia (HCL) shows unique clinicopathological and biological features. HCL responds well to purine analogs but relapses are frequent and novel therapies are required. BRAF-V600E is the key driver mutation in HCL and distinguishes it from other B-cell lymphomas, including HCL-like leukemias/lymphomas (HCL-variant and splenic marginal zone lymphoma). The kinase-activating BRAF-V600E mutation also represents an ideal therapeutic target in HCL. Here, we investigated the biological and therapeutic importance of the activated BRAF-mitogen-activated protein kinase kinase (MEK)-extracellular signal-regulated kinase (ERK) pathway in HCL by exposing in vitro primary leukemic cells purified from 26 patients to clinically available BRAF (vemurafenib; dabrafenib) or MEK (trametinib) inhibitors. Results were validated in vivo in samples from vemurafenib-treated HCL patients within a phase 2 clinical trial. BRAF and MEK inhibitors caused, specifically in HCL (but not HCL-like) cells, marked MEK/ERK dephosphorylation, silencing of the BRAF-MEK-ERK pathway transcriptional output, loss of the HCL-specific gene expression signature, downregulation of the HCL markers CD25, tartrate-resistant acid phosphatase, and cyclin D1, smoothening of leukemic cells' hairy surface, and, eventually, apoptosis. Apoptosis was partially blunted by coculture with bone marrow stromal cells antagonizing MEK-ERK dephosphorylation. This protective effect could be counteracted by combined BRAF and MEK inhibition. Our results strongly support and inform the clinical use of BRAF and MEK inhibitors in HCL.


Figures

Figure 1
Figure 1
Vemurafenib, dabrafenib, and trametinib cause sustained, dose-dependent MEK and ERK dephosphorylation in primary HCL but not HCL-like cells. (A-B, D) Western blot analysis of purified HCL cells from 4 representative patients shows strong phosphorylation of both MEK and ERK under basal conditions (0 nM drug, ie, DMSO vehicle only) and their dose-dependent dephosphorylation after 30 minutes to 72 hours of incubation with the specific active BRAF inhibitors vemurafenib and dabrafenib (A-B) at concentrations ranging from 100 nM to 1000 nM, and with the MEK inhibitor trametinib (D) at concentrations ranging from 10 nM to 100 nM. (C) Conversely, primary leukemic cells from a representative HCL-like patient express a relatively low basal level of phospho-ERK which is not influenced by treatment with up to 1000 nM vemurafenib for 30 minutes to 6 hours. Membranes were probed with antibodies against phospho-ERK1/2 (pERK), phospho-MEK1/2 (pMEK), total ERK1/2, and total MEK1/2 as indicated on the left of each panel. Please note that to obtain, from the HCL-like cell lysates, the pERK bands representatively shown in panel C, the exposure of the pERK blot had to be prolonged (tens of minutes) as compared with HCL cell lysates (tens of seconds in A-B). Solid and dashed lines separate lanes repositioned from the same gel and, respectively, lanes taken from different gels.
Figure 2
Figure 2
Vemurafenib silences the transcriptional output of the BRAF-MEK-ERK pathway in HCL and the whole expression signature distinguishing HCL from normal B cells and other B-cell neoplasms. (A) The overall expression of the 48 genes induced by the BRAF-MEK-ERK pathway in melanoma and colorectal carcinoma is considerably depleted in the profiles of HCL cells treated for 48 and/or 72 hours with vemurafenib (13 samples from 6 patients) vs drug vehicle (11 samples from the same 6 patients), according to GSEA. (B) Color-coded heat map showing, in the individual HCL samples, the expression (red = high; blue = low) of these 48 genes, ranked by their signal-to-noise ratio (the default GSEA metric) in vemurafenib-treated vs vehicle-treated samples. (C) Color-coded expression heat map of genes significantly modulated (twofold change, corrected P < .05) in HCL cells from 6 patients (A-F) treated with vemurafenib 1 µM vs DMSO for 48 and/or 72 hours. (D) The overall expression of the HCL-specific signature (distinguishing HCL from normal B cells and other B-cell neoplasms) is considerably depleted in the profiles of HCL cells (from 6 patients) treated with vemurafenib vs drug vehicle (DMSO) for 48 and/or 72 hours, according to GSEA. NES, normalized enrichment score.
Figure 3
Figure 3
BRAF inhibition downregulates the expression of HCL-specific markers in vivo. (A) Immunohistochemistry shows strong cyclin D1 downregulation (brown nuclear staining) by HCL cells (defined by the blue membrane staining for CD20) in bone marrow biopsies of a trial HCL patient taken before and after 2 weeks of oral treatment with vemurafenib 960 mg twice daily. The arrow in the right panel indicates a cyclin D1+ non-B cell as internal control. (B) Western blotting for cyclin D1, phospho-ERK, and (as loading control) tubulin β in primary leukemic cells purified from the blood of a HCL patient (HCL 1) before and after 2 and 3 days of oral vemurafenib. A mantle cell lymphoma cell line (Jeko-1) and primary purified leukemic cells from a HCL-like patient were used as positive and negative control for cyclin D1 expression, respectively. (C) Flow cytometric expression of surface CD25 in blood leukemic cells (coexpressing CD19 and CD103; blue events in the CD45+ gate) of HCL patient 4 before and after treatment with oral vemurafenib for 7 and 14 days. Red events represent the rest of CD45+ blood cells.
Figure 4
Figure 4
BRAF inhibition trims the hairy projections of HCL but not HCL-like cells. Confocal immunofluorescence staining for phalloidin (green), annexin V (red) and Draq5 (blue) in primary leukemic cells purified from the blood of a representative HCL patient (no. 17, top panels) and a representative HCL-like patient (no. 2, bottom panels) and treated in vitro with vehicle (DMSO) or vemurafenib 1 µM (for 48 and 72 hours in the HCL and HCL-like patient, respectively). (A-B) Two-dimensional (2D) images of a representative field (×63 optical magnification with oil immersion). (C-D) Electronically magnified 2D-image of a representative cell for each condition.
Figure 5
Figure 5
BRAF inhibition induces apoptosis in primary HCL (but not HCL-like cells), which is partially rescued by coculture with bone marrow stromal cells blunting MEK-ERK dephosphorylation. (A) Quantification of apoptosis (by flow cytometry for ANXA5) in leukemic cells from 12 HCL (circles) and 4 HCL-like (squares) patients (supplemental Table 5), treated in vitro for 48 to 96 hours with the indicated drugs in triplicate (average shown), except 2 HCL cases run in duplicate or in single. All HCL cases showed drug-induced reduction of living cells from 1 (vehicle; horizontal bar) down to a maximum of 0.156 (ie, 84.4% relative decrease; P < .05 in all patients analyzed in replicate; supplemental Table 5). Conversely, no HCL-like cases featured such a reduction (and rather displayed a paradoxical increase in some instances). (B) Apoptosis by vemurafenib vs dabrafenib in 4 HCL patients (including 2 relapsed after vemurafenib; denoted with R and not included in panel A), performed in triplicate (circles; horizontal line: average) except in patient HCL 10 (single replicate). In all cases, dabrafenib reduced living cells more (1.3- to 3.8-fold) than vemurafenib in a statistically significant manner (P < .05) for all 3 cases analyzed in triplicate. (C) Western blotting for phospho-ERK1/2 and phospho-MEK1/2 of hairy cell protein lysates from a representative HCL patient (HCL 22; supplemental Table 1) exposed in vitro to the indicated drugs for 6 hours, in the presence or absence of HS5 bone marrow stromal cells. (D) Drug-induced apoptosis in the absence of HS5 cells was reduced (1.2- to 2.3-fold for vemurafenib, 1.7- to 7.3-fold for dabrafenib; P < .05, not shown) upon coculture with HS5 cells in all 4 cases tested except HCL 23. However, in the presence of HS5 cells dabrafenib produced more apoptosis than vemurafenib in 2 of 3 cases (HCL 1R, 1.7-fold; HCL 23, 3.4-fold).
Figure 6
Figure 6
Combined BRAF and MEK inhibition counteracts the protective effect of bone marrow stromal cells against ERK dephosphorylation and HCL cell apoptosis induced by single BRAF or MEK inhibition. (A) Western blot analysis of phospho-ERK1/2 levels in hairy cells purified from patient HCL 24 (supplemental Table 1) and exposed in vitro to the indicated BRAF and MEK inhibitors alone or in combination, for 6 hours, in the presence of HS5 bone marrow stromal cells. After cotreatment with dabrafenib 50 nM and trametinib 1 nM, the phospho-ERK bands, relative to the total ERK bands as loading control, are weaker than after either drug alone (twofold and fivefold weaker, respectively, as quantified in the phospho-ERK/ERK ratio indicated below each lane and obtained by densitometry using the ImageJ software). A similar result was obtained in another HCL patient (no. 26, supplemental Table 1) (B) Flow cytometric quantification of living (ANXA5-negative) cells in primary blood leukemic cells purified from a HCL patient (HCL 25) and in vitro exposed in triplicate for 48 hours to the indicated drugs, in the presence or absence of HS5 stromal cells. In the absence of HS5 cells, trametinib 1 nM and dabrafenib 50 nM were able to induce significant (P < .05, supplemental Table 5) HCL cell apoptosis and their combination was not more effective than dabrafenib alone. Conversely, in the presence of HS5 cells drug-induced apoptosis was dampened but combined BRAF and MEK inhibition resulted in more apoptosis than BRAF or MEK inhibition alone, as quantified in the histograms of panel C (mean ± standard deviation [SD], relative to trametinib 1 nM). A similar result was obtained in another HCL patient (no. 26, supplemental Table 5).

Comment in

References

    1. Foucar MK, Falini B, Catovsky D, Stein H. In: Hairy Cell Leukemia in WHO Classification of Tumours of Haemapoietic and Lymphoid Tissues. Swerdlow SH, Campo E, Harris NL, et al., editors. Lyon, France: International Agency for Research on Cancer; 2008. pp. 188–190.
    1. Falini B, Tiacci E, Liso A, et al. Simple diagnostic assay for hairy cell leukaemia by immunocytochemical detection of annexin A1 (ANXA1). Lancet. 2004;363(9424):1869–1870. - PubMed
    1. Basso K, Liso A, Tiacci E, et al. Gene expression profiling of hairy cell leukemia reveals a phenotype related to memory B cells with altered expression of chemokine and adhesion receptors. J Exp Med. 2004;199(1):59–68. - PMC - PubMed
    1. Tiacci E, Liso A, Piris M, Falini B. Evolving concepts in the pathogenesis of hairy-cell leukaemia. Nat Rev Cancer. 2006;6(6):437–448. - PubMed
    1. Kitagawa Y, Brahmachary M, Tiacci E, Dalla-Favera R, Falini B, Basso K. A microRNA signature specific for hairy cell leukemia and associated with modulation of the MAPK-JNK pathways. Leukemia. 2012;26(12):2564–2567. - PubMed

Publication types

MeSH terms