. 2015 Feb 6;290(6):3377-89.
doi: 10.1074/jbc.M114.608471. Epub 2014 Dec 5.

Lysosomal two-pore channel subtype 2 (TPC2) regulates skeletal muscle autophagic signaling

Affiliations

Lysosomal two-pore channel subtype 2 (TPC2) regulates skeletal muscle autophagic signaling

Pei-Hui Lin et al. J Biol Chem. .

Abstract

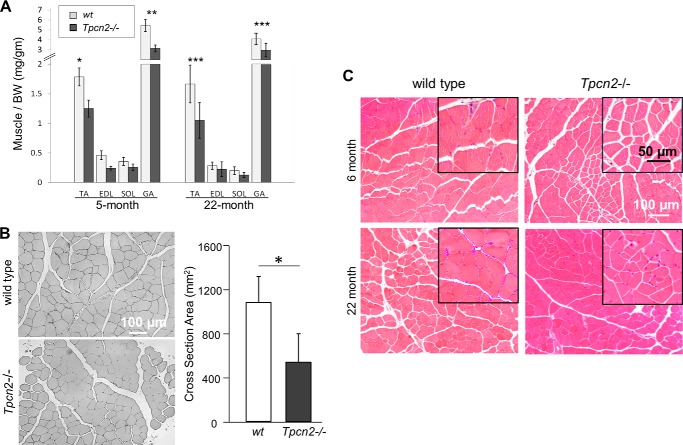
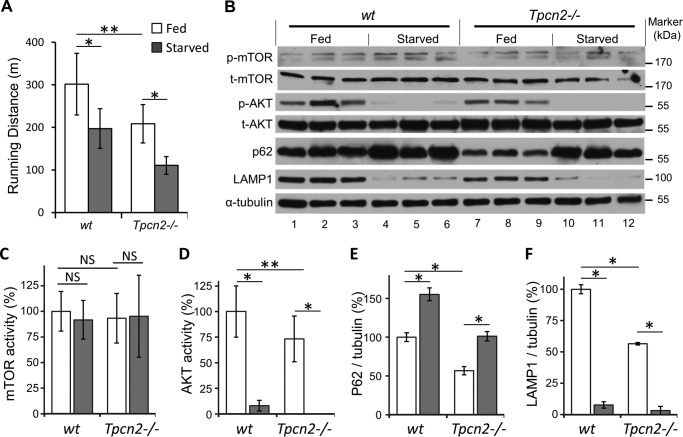
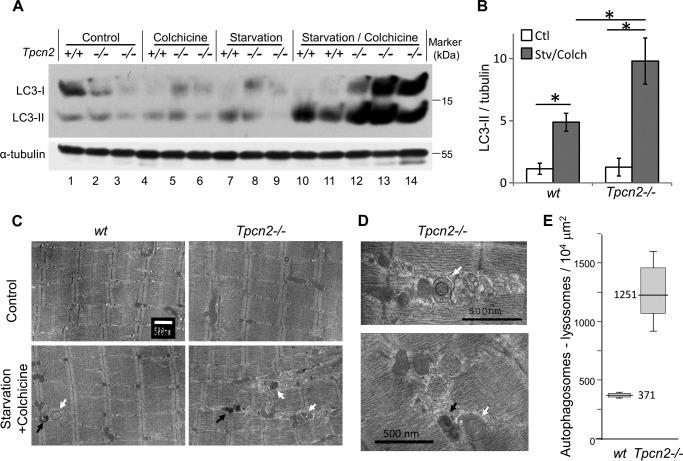
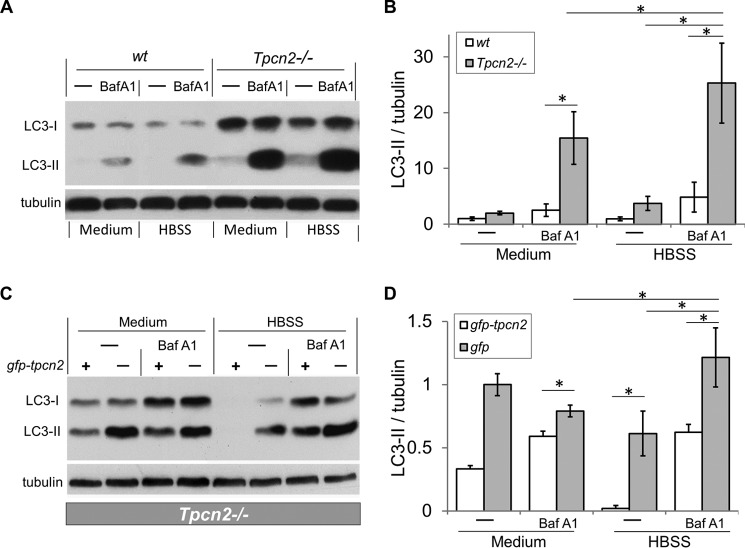
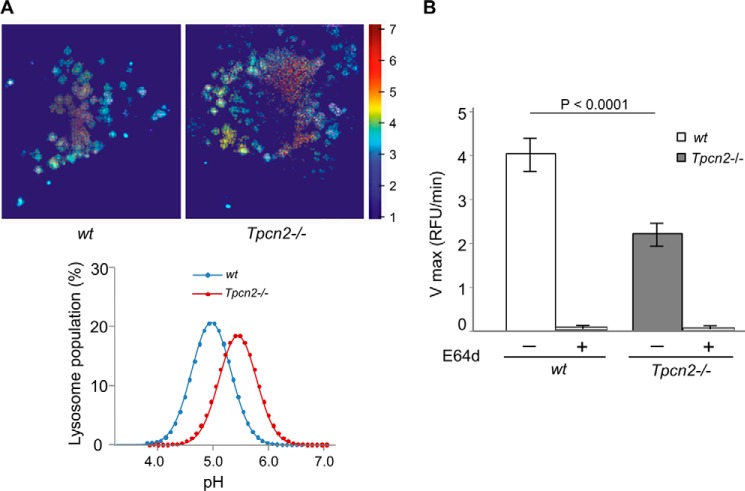
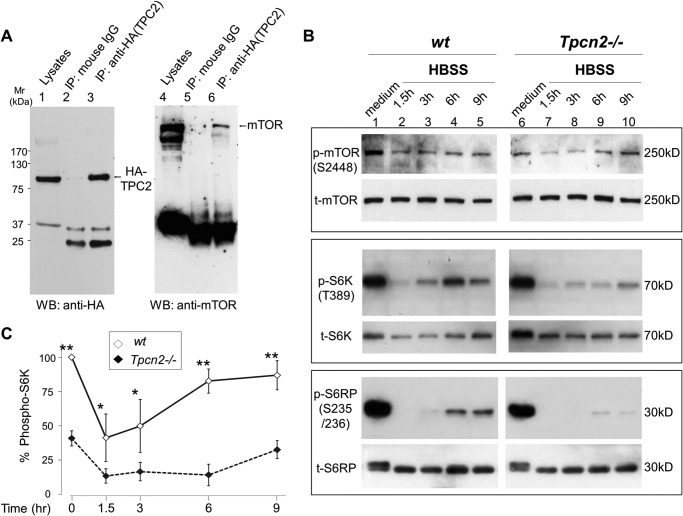
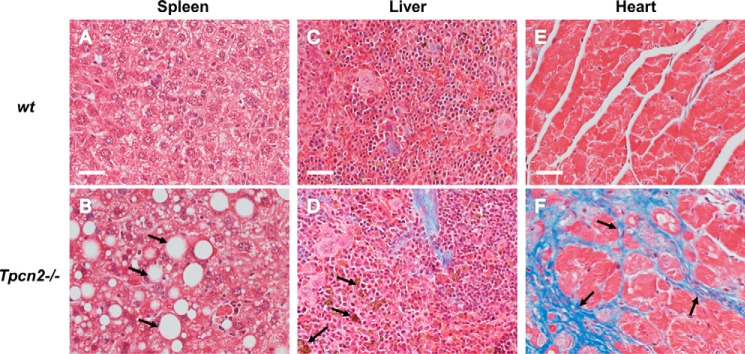
Postnatal skeletal muscle mass is regulated by the balance between anabolic protein synthesis and catabolic protein degradation, and muscle atrophy occurs when protein homeostasis is disrupted. Autophagy has emerged as critical in clearing dysfunctional organelles and thus in regulating protein turnover. Here we show that endolysosomal two-pore channel subtype 2 (TPC2) contributes to autophagy signaling and protein homeostasis in skeletal muscle. Muscles derived from Tpcn2(-/-) mice exhibit an atrophic phenotype with exacerbated autophagy under starvation. Compared with wild types, animals lacking TPC2 demonstrated an enhanced autophagy flux characterized by increased accumulation of autophagosomes upon combined stress induction by starvation and colchicine treatment. In addition, deletion of TPC2 in muscle caused aberrant lysosomal pH homeostasis and reduced lysosomal protease activity. Association between mammalian target of rapamycin and TPC2 was detected in skeletal muscle, allowing for appropriate adjustments to cellular metabolic states and subsequent execution of autophagy. TPC2 therefore impacts mammalian target of rapamycin reactivation during the process of autophagy and contributes to maintenance of muscle homeostasis.

Keywords: Autophagy; Calcium Channel; Lysosome; Muscle Atrophy; Protein Turnover.


Figures

FIGURE 1.
FIGURE 1.
Atrophic muscle phenotype of Tpcn2−/− mice. A, various skeletal muscle types were dissected from 5- and 22-month-old wild type and Tpcn2−/− animals. The relative muscle weight to body weight (BW) was calculated. Error bars denote S.D. (n = 9 for 5-month-old mice; n = 6 for 22-month-old mice; *, p < 0.05; **, p < 0.01; ***, p < 0.001). B, representative cross-sections of the TA muscle from wild type and Tpcn2−/− animals (5-months old) stained with anti-dystrophin to reveal myofiber boundaries. Quantification of the TA myofiber cross-sectional area is shown in the bar chart. Values are means ± S.E. (n = 4 mice for each group;*, p < 0.01). C, H&E staining of TA muscle from young (6-month-old) and aged (22-month-old) wild type (left panels) or Tpcn2−/− (right panels) mice. No gross myopathy, such as central nuclei and fibrosis, was observed in Tpcn2−/− muscles.
FIGURE 2.
FIGURE 2.
Reduced endurance and altered autophagic signaling in skeletal muscle of Tpcn2−/− mice. A, mice (male; 4–5 months old) were tested on a treadmill under dietary conditions of regular chow or 3-day fasting. The distances traveled (in meters) until exhaustion were recorded and analyzed (n = 6 mice/group). Data are means ± S.E. (*, p < 0.05; **, p < 0.01). B, autophagy flux studies under regular diet or extended starvation. Mice (male; 4–5 months old) were fed with regular chow or fasted for 3 days. The TA muscles were then harvested and homogenized for immunoblotting with p-mTOR, total mTOR (t-mTOR), p-AKT, total AKT (t-AKT), p62, LAMP1, and α-tubulin. C–F, densitometry quantification of mTOR activity (p-mTOR/total mTOR; C), AKT activity (p-AKT/total AKT; D), normalized (over α-tubulin) p62 (E), and LAMP1 (F). Error bars represent S.E. (n = 6 mice/group; *, p < 0.05; **, p < 0.01; NS, not significant; analysis of variance).
FIGURE 3.
FIGURE 3.
Exacerbated autophagosome accumulation in Tpcn2−/− skeletal muscle in response to microtubule inhibitor during starvation. A and B, immunoblots of LC3 and α-tubulin in TA muscle homogenates (100 μg/lane) of 5-month-old wild type (+/+) and Tpcn2−/− (−/−; as denoted on the top of the lanes) mice under regular fed condition (control; lanes 1–3), after a 2-day treatment with either colchicine alone (lanes 4–6) or starvation alone (lanes 7–9), or a combination of starvation plus colchicine (lanes 10–14). B, densitometry quantification of normalized LC3-II levels (over tubulin) under the control condition (Ctl) or after starvation/colchicine treatment (Stv/Colch). Error bars represent S.E. C, electron micrographs of TA muscles derived from wild type and Tpcn2−/− mice. The scale bar represents 500 nm. An apparent increase in the number of autophagosomes (white arrows) and lysosomes (black arrows) was observed in the Tpcn2−/− TA muscle after starvation/colchicine treatment. D, enlarged electron micrographs from autophagic Tpcn2−/− TA muscle showing autophagosome (top panel, white arrow) and mitophagy (lower panel, white arrow). The lysosome is marked with a black arrow. E, the numbers of apparent autophagosomes plus lysosomes derived from 10–12 muscle cells/sample in wild type and Tpcn2−/− TA following starvation/colchicine-induced autophagy. Data are expressed as numbers of autophagosomes plus lysosomes over the area of 104 μm2. Error bars represent S.E. (n = 4 mice/condition).
FIGURE 4.
FIGURE 4.
Exacerbated autophagosome accumulation in cultured myotubes from Tpcn2−/− mice under nutrient deprivation and inhibition of vacuolar H+-ATPase. A, differentiated myotubes derived from the wild type or Tpcn2−/− neonates were subjected to autophagy flux measurement (see “Experimental Procedures”). Baf A1 at concentration of 200 nm was used to inhibit the vacuolar H+-ATPase in the lysosome. HBSS was used to induce starvation of the cells. Cell lysates (40 μg of proteins/lane) were used for immunoblotting with anti-LC3 or anti-α-tubulin. B, relative levels of LC3-II/tubulin. Data are expressed as -fold induction relative to that of the wild type at basal condition (medium) (n = 4 experiments). Data are means ± S.E. (*, p < 0.01). C, Tpcn2−/− myoblasts were transfected with either gfp-tpcn2 plasmid (odd-numbered lanes) or pcms-eGFP plasmid (even-numbered lanes) for 48 h and then subjected to autophagy flux analysis. Cell lysates (30 μg of proteins/lane) were collected for immunoblots with anti-LC3 or anti-α-tubulin. D, relative levels of LC3-II/tubulin. Data (means ± S.E.) are expressed as LC3-II/tubulin normalized to that obtained from pcms-eGFP-transfected Tpcn2−/− cells cultured under basal conditions (medium; lane 2) (n = 3 experiments). Error bars represent S.E.
FIGURE 5.
FIGURE 5.
TPC2-null skeletal muscle exhibits altered intralysosomal pH and impaired lysosomal acid enzyme activity. A, lysosomal pH in wild type and Tpcn2 knock-out myoblasts. Wild type and Tpcn2−/− myoblasts were isolated, and the lysosomal pH was measured by pH-sensitive ratiometric imaging of Oregon Green 514-labeled dextran taken up by myoblasts under regular medium conditions. Representative Oregon Green 514-dextran labeled lysosomes from wild type (top left) and Tpcn2−/− (top right) myoblasts are shown. The histograms of the lysosomal pH distribution values (fitted to a Maxwell-Boltzmann curve) are shown (bottom). The means ± S.E. from three experiments are 4.97 ± 0.32 for wild type and 5.40 ± 0.23 for Tpcn2−/−. B, acid protein extracts derived from GA muscles of wild type (wt) or Tpcn2 −/− mice (6-months old) were used to measure the cathepsin protease kinetics with 20 μm Z-FR-AMC fluorogenic peptide as the substrate. Specific cathepsin activity was assessed using the cysteine protease inhibitor E64d. The Vmax for wild type muscle is 4.03 ± 0.38, whereas for Tpcn2−/− muscle, Vmax is 2.20 ± 0.26. Values are means ± S.E. (n = 6 mice). Error bars represent S.E. RFU, relative fluorescence units.
FIGURE 6.
FIGURE 6.
Reduced mTOR activity and delayed mTOR reactivation during starvation in cultured myotubes from Tpcn2−/− mice. A, physical association between TPC2 and mTOR in skeletal muscle. TA muscle transfected with HA-TPC2 was used for a co-immunoprecipitation (IP) assay to test the association between HA-TPC2 and mTOR. Immunoprecipitation was performed with anti-HA (12CA5) antibody or with mouse IgG as a control. The left panel shows an immunoblot with anti-HA, and the right panel shows an immunoblot with anti-mTOR. B, myotubes derived from wild type or Tpcn2−/− were subjected to HBSS starvation treatment for different time periods as denoted. Cell lysates (40 μg/lane; lanes 1–5, wild type; lanes 6–10, Tpcn2−/−) were analyzed by immunoblotting of p-mTOR(Ser-2448) and total mTOR (t-mTOR) (top panels); p-S6K(Thr-389) and total S6K (t-S6K) (middle panels), and p-S6RP(Ser-235/236) and total S6RP (t-S6RP) (bottom panels). C, mTOR activities were compared based on the relative p-S6K (p-S6K/total S6K) levels. Data are expressed as percentage of p-S6K (p-S6K/total S6K) in relation to the value from wild type medium control. Values are means ± S.E. (n = 4 experiments; *, p < 0.05; **, p < 0.01). Error bars represent S.E. WB, Western blot.
FIGURE 7.
FIGURE 7.
Histopathological micrographs of aged tissues. A–F, representative trichrome staining of spleen (A and B), liver (C and D), and heart (E and F) derived from 22-month-old wild type (A, C, and E) or Tpcn2−/− (B, D, and F) mice. Abundant empty vacuoles (B, arrows) from spleen, lipofuscin deposits (D, arrows) from liver, and fibrosis (F, arrows) from heart were found in aged tissues from Tpcn2−/− mice. Scale bars, 50 μm.

References

    1. Rennie M. J., Wackerhage H., Spangenburg E. E., Booth F. W. (2004) Control of the size of the human muscle mass. Annu. Rev. Physiol. 66, 799–828 - PubMed
    1. Schiaffino S., Dyar K. A., Ciciliot S., Blaauw B., Sandri M. (2013) Mechanisms regulating skeletal muscle growth and atrophy. FEBS J. 280, 4294–4314 - PubMed
    1. Choi A. M., Ryter S. W., Levine B. (2013) Autophagy in human health and disease. N. Engl. J. Med. 368, 651–662 - PubMed
    1. Sandri M. (2010) Autophagy in skeletal muscle. FEBS Lett. 584, 1411–1416 - PubMed
    1. Mizushima N., Komatsu M. (2011) Autophagy: renovation of cells and tissues. Cell 147, 728–741 - PubMed

Publication types

LinkOut - more resources