

Dynamic regulation of D-serine release in the vertebrate retina
- PMID: 25480802
- PMCID: PMC4398525
- DOI: 10.1113/jphysiol.2014.283432
Dynamic regulation of D-serine release in the vertebrate retina
Abstract
Key points: Activation of NMDA receptors (NMDARs) is essential for encoding visual stimuli into signals for the brain, although their over-activation can cause cell death. The recruitment of NMDARs is important for encoding light intensity in retinal ganglion cells. D-serine binding is essential for proper activation of NMDARs, although its role in signal processing and the mechanisms that underlie its availability are not well understood. In these light-evoked experiments, the addition of exogenous D-serine had a large effect on low contrast and low intensity NMDAR responses that decreased as the intensity was increased. The degradation of endogenous D-serine decreased the responses more at higher intensities. The results provide compelling evidence favouring a new interpretation of NMDAR recruitment in which light-evoked D-serine release serves an important regulatory control over the recruitment of NMDARs.
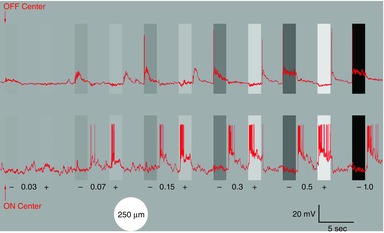
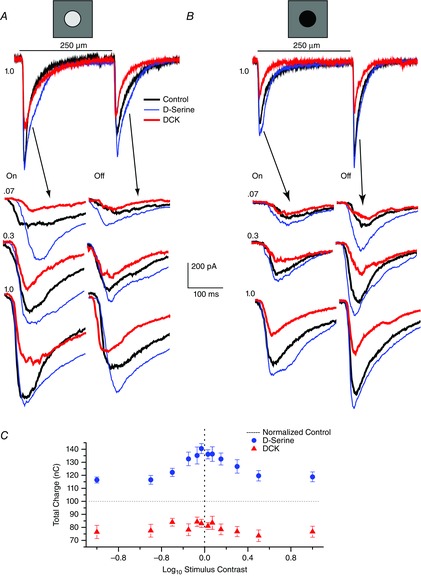
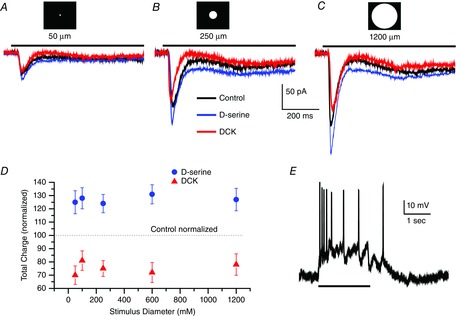
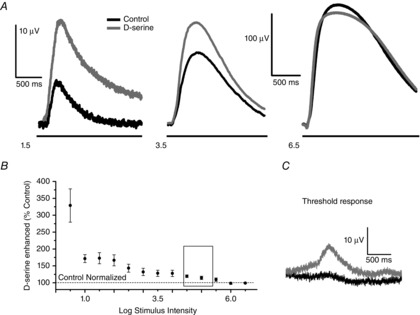
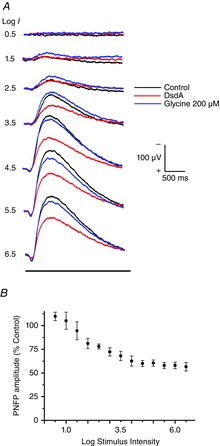
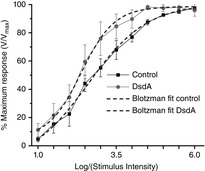
Abstract: The present study aimed to investigate the functional properties of NMDA receptor coagonist release and to specifically evaluate whether light-evoked release mechanisms contribute to the availability of the coagonist D-serine. Two different methods were involved in our approach: (i) whole-cell recordings from identified retinal ganglion cells in the tiger salamander were used to study light adaptation with positive and negative contrast stimuli over a range of ± 1 log unit against a steady background illumination and (ii) the mechanisms for intensity encoding to a range of light intensities covering 6 log10 units were investigated. This latter study employed extracellular recordings of the proximal negative field potential, pharmacologically manipulated to generate a pure NMDA mediated response. For the adaptation study, we examined the light-evoked responses under control conditions, followed by light stimuli presented in the presence of D-serine, followed by light stimulation in the presence of dichlorokynurenic acid to block the coagonist site of NMDA receptors. For the brightness encoding studies, we examined the action of D-serine on each intensity used and then applied the enzyme D-serine deaminase to remove significant levels of D-serine. These studies provided new insights into the mechanisms that regulate coagonist availability in the vertebrate retina. Our results strongly support the idea that light-evoked coagonist release, a major component of which is D-serine, is needed to provide the full range of coagonist availability for optimal activation of NMDA receptors.
© 2014 The Authors. The Journal of Physiology © 2014 The Physiological Society.
Figures
Similar articles
-
Endogenous D-serine contributes to NMDA-receptor-mediated light-evoked responses in the vertebrate retina.J Neurophysiol. 2007 Jul;98(1):122-30. doi: 10.1152/jn.00057.2006. Epub 2007 May 16. J Neurophysiol. 2007. PMID: 17507508
-
Glycine transport accounts for the differential role of glycine vs. D-serine at NMDA receptor coagonist sites in the salamander retina.Eur J Neurosci. 2010 Mar;31(5):808-16. doi: 10.1111/j.1460-9568.2010.07135.x. Eur J Neurosci. 2010. PMID: 20374282 Free PMC article.
-
AMPA receptor-dependent, light-evoked D-serine release acts on retinal ganglion cell NMDA receptors.J Neurophysiol. 2012 Aug;108(4):1044-51. doi: 10.1152/jn.00264.2012. Epub 2012 May 16. J Neurophysiol. 2012. PMID: 22592312 Free PMC article.
-
D-serine regulation of NMDA receptor activity.Sci STKE. 2006 Oct 10;2006(356):pe41. doi: 10.1126/stke.3562006pe41. Sci STKE. 2006. PMID: 17033043 Review.
-
Analysis of free D-serine in mammals and its biological relevance.J Chromatogr B Analyt Technol Biomed Life Sci. 2011 Nov 1;879(29):3169-83. doi: 10.1016/j.jchromb.2011.08.030. Epub 2011 Aug 30. J Chromatogr B Analyt Technol Biomed Life Sci. 2011. PMID: 21992750 Review.
Cited by
-
Effects of D-serine treatment on outer retinal function.Exp Eye Res. 2021 Oct;211:108732. doi: 10.1016/j.exer.2021.108732. Epub 2021 Aug 20. Exp Eye Res. 2021. PMID: 34419444 Free PMC article.
-
Metabolomic analyses of vigabatrin (VGB)-treated mice: GABA-transaminase inhibition significantly alters amino acid profiles in murine neural and non-neural tissues.Neurochem Int. 2019 May;125:151-162. doi: 10.1016/j.neuint.2019.02.015. Epub 2019 Feb 26. Neurochem Int. 2019. PMID: 30822440 Free PMC article.
-
Investigating brain d-serine: Advocacy for good practices.Acta Physiol (Oxf). 2019 May;226(1):e13257. doi: 10.1111/apha.13257. Epub 2019 Feb 14. Acta Physiol (Oxf). 2019. PMID: 30650253 Free PMC article. Review.
References
-
- Burkhardt DA. Proximal negative response of frog retina. J Neurophysiol. 1970;33:405–420. - PubMed
-
- Burkhardt DA, Fahey PK. Sikora M. Responses of ganglion cells to contrast steps in the light-adapted retina of the tiger salamander. Vis Neurosci. 1998;15:219–229. - PubMed
-
- Burkhardt DA, Gottesman J. Thoreson WB. An eyecup slice preparation for intracellular recording in vertebrate retinas. J Neurosci Methods. 1989;28:179–187. - PubMed
-
- Coleman PA. Miller RF. Measurment of passive membrane parameters with whole-cell recording from neurons in the intact amphibian retina. J Neurophysiol. 1989;61:218–230. - PubMed
-
- Diamond JS. Copenhagen DR. The contribution of NMDA and non-NMDA receptors to the light-evoked input-output characteristics of retinal ganglion cells. Neuron. 1993;11:725–738. - PubMed
Publication types
MeSH terms
Substances
Grants and funding
LinkOut - more resources
Full Text Sources
Other Literature Sources