. 2015 Jan 1;142(1):118-27.
doi: 10.1242/dev.114843. Epub 2014 Dec 5.

Chd1 is essential for the high transcriptional output and rapid growth of the mouse epiblast

Affiliations

Chd1 is essential for the high transcriptional output and rapid growth of the mouse epiblast

Marcela Guzman-Ayala et al. Development. .

Abstract

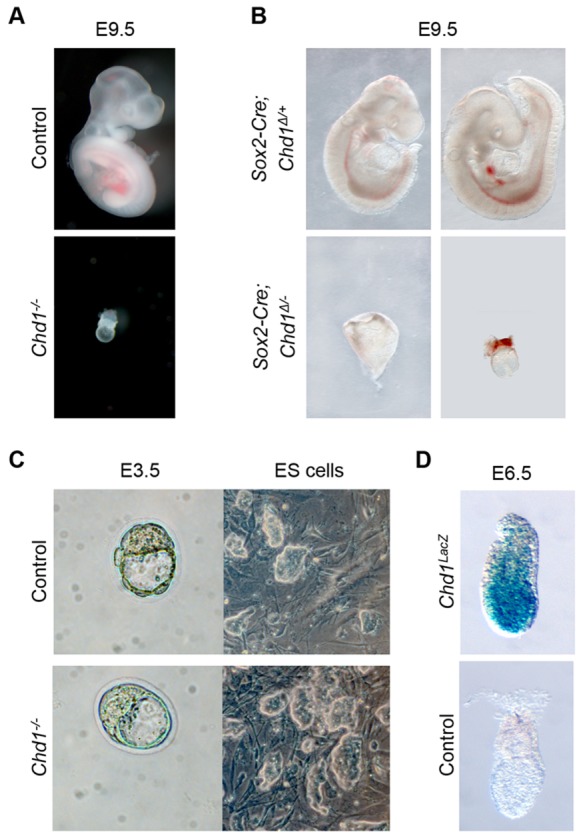
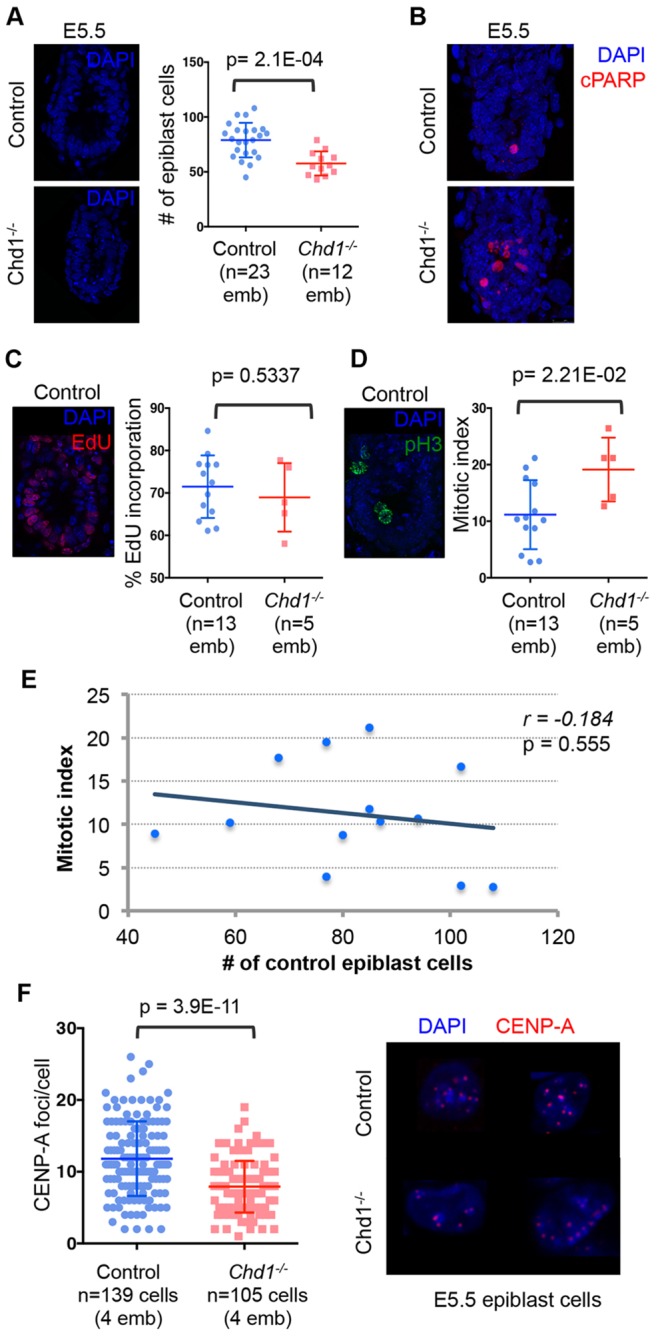
The pluripotent mammalian epiblast undergoes unusually fast cell proliferation. This rapid growth is expected to generate a high transcriptional demand, but the underlying mechanisms remain unknown. We show here that the chromatin remodeler Chd1 is required for transcriptional output and development of the mouse epiblast. Chd1(-/-) embryos exhibit proliferation defects and increased apoptosis, are smaller than controls by E5.5 and fail to grow, to become patterned or to gastrulate. Removal of p53 allows progression of Chd1(-/-) mutants only to E7.0-8.0, highlighting the crucial requirement for Chd1 during early post-implantation development. Chd1(-/-) embryonic stem cells (ESCs) have a self-renewal defect and a genome-wide reduction in transcriptional output at both known mRNAs and intergenic transcripts. These transcriptional defects were only uncovered when cell number-normalized approaches were used, and correlate with a lower engagement of RNAP II with transcribed genes in Chd1(-/-) ESCs. We further show that Chd1 directly binds to ribosomal DNA, and that both Chd1(-/-) epiblast cells in vivo and ESCs in vitro express significantly lower levels of ribosomal RNA. In agreement with these findings, mutant cells in vivo and in vitro exhibit smaller and more elongated nucleoli. Thus, the RNA output by both Pol I and II is reduced in Chd1(-/-) cells. Our data indicate that Chd1 promotes a globally elevated transcriptional output required to sustain the distinctly rapid growth of the mouse epiblast.

Keywords: Chromatin; Epiblast proliferation; Epigenetics; Pluripotency; Transcription.


Figures

Fig. 1.
Fig. 1.
Chd1 is required for development of the post-implantation mouse epiblast. (A) Chd1/ embryos recovered at E9.5 are in the process of being resorbed. (B) Epiblast-specific deletion of Chd1 (Sox2-Cre;Chd1Δ/) phenocopies the Chd1/ phenotype and leads to resorption at E9.5 when compared with littermate controls (Sox2-Cre;Chd1Δ/+). (C) There is no obvious morphological difference between control and Chd1/ blastocysts at E3.5, and Chd1/ ESCs can be derived. (D) The Chd1lacZ reporter allele is preferentially expressed in the epiblast at E6.5 (top); control embryos (bottom) not carrying the reporter allele show no signal when stained with X-gal. All images for each panel were taken at the same magnification.
Fig. 2.
Fig. 2.
The epiblast forms but is not maintained in Chd1−/− embryos. (A) At E5.5, mRNAs of the epiblast markers Oct4, Nodal and Fgf5 are expressed normally in control (top) and Chd1/ embryos (bottom) (Oct4, n=4; Nodal, n=4; Fgf5, n=3). (B) At E6.5, Chd1/ embryos (bottom) are smaller than controls (top) and have reduced expression of Oct4 (n=6) and Fgf5 mRNA (n=7). Mutant embryos also fail to establish A/P patterning of the epiblast: Chd1/ embryos do not induce expression of posterior/primitive streak mRNAs T (n=2) nor Wnt3 (n=3), and do not express the AVE protein marker Lefty1 (n=7). In control embryos, anterior is to the left and posterior to the right. All WISH images were taken at the same magnification. Scale bars: 50 µm.
Fig. 3.
Fig. 3.
The Chd1−/− epiblast does not grow due to defective cell cycle and increased apoptosis. (A) The number of cells of the E5.5 epiblast is significantly reduced in Chd1/ embryos compared with control embryos. (B) Representative embryos stained for cParp showing that apoptotic cells are consistently detected in Chd1/ embryos (7/7), but are rarely observed (1-2 cells in 4/20 embryos) or not at all (0 cells in 16/20 embryos) in controls. Images represent a projection of five different confocal planes through the embryo. (C) Chd1/ embryos show no significant difference in proportion of cells incorporating EdU in the epiblast compared with controls at E5.5. (D) The mitotic index, calculated as the percentage of epiblast cells stained with pH3, is significantly higher in the Chd1/ epiblast (19.15±5.631) compared with the control epiblast (11.17±6.095) at E5.5. (E) There is no correlation between mitotic index and number of epiblast cells in control embryos, suggesting that the increased mitotic index of the mutants is not due to a developmental delay. (F) The number of CENP-A foci detected per epiblast cell is significantly reduced in mutants (7.914±3.601) compared with controls (11.82±5.197) at E5.5. All results are mean±s.d. In all cases, a single z-stack from one representative embryo with DAPI staining and IF for the indicated marker is shown, with the exception of panel B, in which a full projection is shown.
Fig. 4.
Fig. 4.
Chd1 is required for optimal transcriptional output. (A,B) The cell number-normalized transcriptional output of Chd1/ ESCs is reduced genome-wide at both known mRNAs (A) and intergenic transcripts (B). Blue dots and the blue regression line represent the exogenous spike-in RNAs used for RNA-seq data normalization, red dots and the red regression line represent known mRNA or intergenic transcripts levels in normalized FPKM. (C) The reduction in known mRNA and intergenic transcripts expression in Chd1/ ESCs is observed across all expression levels. Shown are distribution plots of the fold change in mutant cells relative to controls using the RNA-seq data combined from both biological replicates for all genes or each quartile of gene expression levels. Vertical red unbroken lines mark the median fold change in mRNAs, vertical red dashed lines mark the median fold change in intergenic transcripts, vertical black dashed lines indicate the no change value (fold change=1). m.a.d., median absolute deviation. (D) RNAP II S2p levels are reduced in Chd1/ cells, predominantly at the gene body (GB) of highly transcribed genes examined by ChIP-qPCR. (E) Total RNAP II is reduced at both the transcriptional start site (TSS) and GB in mutant ESCs. An intergenic region from chromosome 8 (Int_ch8) was used as negative control and the gene body of Gapdh as positive control. Min, minor satellites, corresponding to centromeric sequences. Data shown are representative of two (RNA-seq) or three (ChIP-qPCR) biological replicates.
Fig. 5.
Fig. 5.
Chd1 directly targets rDNA and regulates pre-rRNA transcription. (A) ChIP-qPCR shows Chd1 enrichment at the enhancer, promoter and body of the rDNA transcription unit. A schematic representation of the ribosomal DNA repeat and primers used is shown below the graph. ETS, external transcribed spacer; ITS, internal transcribed spacer; IGS, intergenic spacer. Wild-type (WT) cells without the Chd1-Flag knock-in were used as negative control. Significance assessed using unpaired t-test, *P<0.05, **P<0.01. (B) Chd1/ ESCs express lower levels of pre-rRNA per cell. Cell number-normalized qRT-PCR was carried out in two independently derived ES cell lines. (C) Chd1/ epiblast cells express lower levels of pre-rRNA per cell. Images are a reconstitution of four different planes of representative embryos processed for pre-rRNA FISH, with higher magnification images of representative single epiblast cells on the right. (D) IF for nucleolin in E5.5 epiblast cells in vivo and ESCs in vitro reveal that the nucleoli are more elongated and smaller in Chd1/ cells than in control cells. Graphs represent quantification of this analysis of two independently derived ES cell lines. Circularity: control=0.75±0.17 and Chd1/=0.60±0.21. 1.0 represents a perfect circle. Size: control=13.91±10.89 and Chd1/=9.51±8.3. All results are mean±s.d.

References

    1. Ahmed K., Dehghani H., Rugg-Gunn P., Fussner E., Rossant J. and Bazett-Jones D. P. (2010). Global chromatin architecture reflects pluripotency and lineage commitment in the early mouse embryo. PLoS ONE 5, e10531 10.1371/journal.pone.0010531 - DOI - PMC - PubMed
    1. Amano T., Papanikolaou T., Sung L.-Y., Lennington J., Conover J. and Yang X. (2009). Nuclear transfer embryonic stem cells provide an in vitro culture model for Parkinson's disease. Cloning Stem Cells 11, 77-88 10.1089/clo.2008.0059 - DOI - PubMed
    1. Ang Y.-S., Tsai S.-Y., Lee D.-F., Monk J., Su J., Ratnakumar K., Ding J., Ge Y., Darr H., Chang B. et al. (2011). Wdr5 mediates self-renewal and reprogramming via the embryonic stem cell core transcriptional network. Cell 145, 183-197 10.1016/j.cell.2011.03.003 - DOI - PMC - PubMed
    1. Bedzhov I. and Zernicka-Goetz M. (2014). Self-organizing properties of mouse pluripotent cells initiate morphogenesis upon implantation. Cell 156, 1032-1044 10.1016/j.cell.2014.01.023 - DOI - PMC - PubMed
    1. Brennan J., Lu C. C., Norris D. P., Rodriguez T. A., Beddington R. S. P. and Robertson E. J. (2001). Nodal signalling in the epiblast patterns the early mouse embryo. Nature 411, 965-969 10.1038/35082103 - DOI - PubMed

Publication types

MeSH terms