. 2014 Dec 6:14:920.
doi: 10.1186/1471-2407-14-920.

Human Hematopoietic Signal peptide-containing Secreted 1 (hHSS1) modulates genes and pathways in glioma: implications for the regulation of tumorigenicity and angiogenesis

Affiliations

Human Hematopoietic Signal peptide-containing Secreted 1 (hHSS1) modulates genes and pathways in glioma: implications for the regulation of tumorigenicity and angiogenesis

Katiana S Junes-Gill et al. BMC Cancer. .

Abstract

Background: Human Hematopoietic Signal peptide-containing Secreted 1 (hHSS1) is a truly novel protein, defining a new class of secreted factors. We have previously reported that ectopic overexpression of hHSS1 has a negative modulatory effect on cell proliferation and tumorigenesis in glioblastoma model systems. Here we have used microarray analysis, screened glioblastoma samples in The Cancer Genome Atlas (TCGA), and studied the effects of hHSS1 on glioma-derived cells and endothelial cells to elucidate the molecular mechanisms underlying the anti-tumorigenic effects of hHSS1.

Methods: Gene expression profiling of human glioma U87 and A172 cells overexpressing hHSS1 was performed. Ingenuity® iReport™ and Ingenuity Pathway Analysis (IPA) were used to analyze the gene expression in the glioma cells. DNA content and cell cycle analysis were performed by FACS, while cell migration, cell invasion, and effects of hHSS1 on HUVEC tube formation were determined by transwell and matrigel assays. Correlation was made between hHSS1 expression and specific genes in glioblastoma samples in the TCGA database.

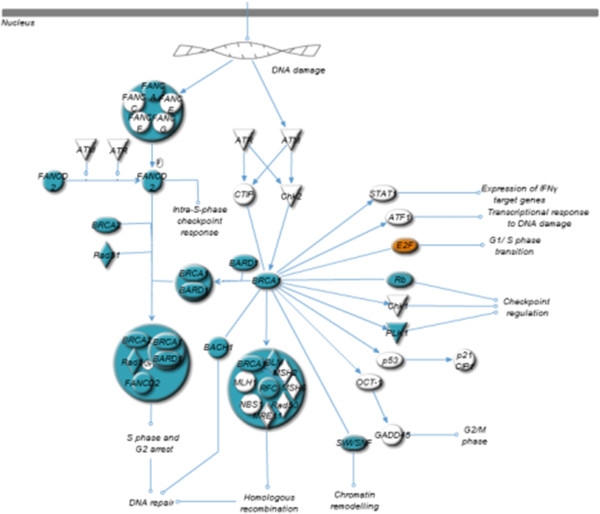
Results: We have clarified the signaling and metabolic pathways (i.e. role of BRCA1 in DNA damage response), networks (i.e. cell cycle) and biological processes (i.e. cell division process of chromosomes) that result from hHSS1effects upon glioblastoma growth. U87-overexpressing hHSS1 significantly decreased the number of cells in the G0/G1 cell cycle phase, and significantly increased cells in the S and G2/M phases (P < 0.05). U87-overexpressing hHSS1 significantly lost their ability to migrate (P < 0.001) and to invade (P < 0.01) through matrigel matrix. hHSS1-overexpression significantly decreased migration of A172 cells (P < 0.001), inhibited A172 tumor-induced migration and invasion of HUVECs (P < 0.001), and significantly inhibited U87 tumor-induced invasion of HUVECs (P < 0.001). Purified hHSS1 protein inhibited HUVEC tube formation. TCGA database revealed significant correlation between hHSS1 and BRCA2 (r = -0.224, P < 0.0005), ADAMTS1 (r = -0.132, P <0.01) and endostatin (r = 0.141, P < 0.005).

Conclusions: hHSS1-overexpression modulates signaling pathways involved in tumorigenesis. hHSS1 inhibits glioma-induced cell cycle progression, cell migration, invasion and angiogenesis. Our data suggest that hHSS1 is a potential therapeutic for malignant glioblastoma possessing significant antitumor and anti-angiogenic activity.


Figures

Figure 1
Figure 1
Top molecular networks of genes up- and down-regulated in U87 and A172 cells overexpressing h HSS1. Network of genes based on connectivity identified by IPA analysis. A) Top gene network of U87 cells depicting genes involved in cell cycle, cell death, DNA replication, recombination and repair. ANKRD1 was the most up-regulated gene. Many genes with a direct and indirect relationship with E2F gene were down-regulated by HSS1. B) Top gene network of A172-hHSS1 C#7 showing genes involved in cell cycle, cellular assembly and organization, DNA replication, recombination and repair. Several genes down-regulated by hHSS1 in A172 C#7 cells are target genes regulated by VEGF. C) Top gene network of A172-hHSS1 C#8 showing genes involved in tissue morphology and cellular development. Some of the hHSS1 modulated genes in A172 C#8 cells are responsible for ERK regulation. Different shapes of the nodes (genes/gene products) represent the functional classes of the gene products and the lines represent the biological relationships between the nodes. The length of an edge reflects the evidence in the literature supporting that node-to-node relationship. The intensity of the node color indicates the degree of up- (red) or down-regulation (green) of the respective gene. Gray represents a gene related to the others that did not meet the cutoff criteria. A solid line without arrow indicates protein-protein interaction. Arrows indicate the direction of action (either with or without binding) of one gene to another.
Figure 2
Figure 2
Role of BRCA in DNA damage response pathway is regulated by h HSS1-overexpression in U87 cells. Blue color indicates down-regulation of a gene, orange color indicates up-regulation of a gene. This analysis was done using Ingenuity iReport.
Figure 3
Figure 3
Mitotic roles of polo-like kinase pathway is regulated by h HSS1-overexpression in U87 cells. Blue color indicates down-regulation of a gene, orange color indicates up-regulation of a gene. This analysis was done using Ingenuity iReport.
Figure 4
Figure 4
Validation of selected genes differentially expressed by h HSS1 overexpression in U87 and A172 cells. Blue color indicates genes validated by qRT-PCR. Red color indicates genes differentially expressed by microarray analysis. A) Genes differentially expressed in U87 cells. B) Genes differentially expressed in A172-hHSS1 C#7 and C) A172-hHSS1 C#8.
Figure 5
Figure 5
Effect of h HSS1 on cell cycle phases for glioma cells. Cell cycle analysis in A) U87 cells and B) A172 cells. Cell cycle analysis was performed by propidium iodide staining followed by flow cytometry using day 4 and 5 from a U87 and A172 cell growth curve, respectively. Columns represent the mean percentage of cells in each phase of the cell cycle ± SEM (n = 2), P < 0.05, one way ANOVA with post hoc pairwise Tukey test.
Figure 6
Figure 6
Overexpression of h HSS1 significantly affects the migration and invasion of glioma cells. A) Transwell migration assay for U87 and A172 cells overexpressing hHSS1 or control vector. B) Matrigel invasion assay for U87 and A172 cells overexpressing hHSS1 or control. 10% FBS serum was added as chemoattractant. After 24 h incubation, cells that migrated through the membrane or invaded through the matrix were fixed, stained with H&E and pictures (200x, magnification) of 9 fields of each replicate was taken for cells counting. Two independent experiments using duplicates were done for each assay. Data shown are mean ± SEM. **P < 0.01; ***P < 0.001, t-test.
Figure 7
Figure 7
Overexpression of h HSS1 impacts U87 and A172 tumor-induced HUVEC migration and invasion. A) Transwell migration and invasion assay for HUVEC co-cultured with U87 cells overexpressing hHSS1 or control vector. B) Transwell migration and invasion assay for HUVEC co-cultured with A172 cells overexpressing hHSS1 or control vector. Glioma cells were seeded in the bottom chamber containing media with 2% FBS. After 24 h, media was changed to serum-free media supplemented with 0.1% BSA. HUVEC were seeded in the upper chamber containing media with 0.1% BSA. A172 or U87 cells were seeded at 10:1 ratio of HUVEC. After 24 h, cells that migrated and invaded the matrix were fixed, stained with H&E and pictures (200x, magnification) of 21 fields of each replicate were taken for cells counting. Two independent experiments using duplicates were done for each assay. Data shown are mean ± SEM. ***P < 0.001, t-test. Black arrow shows net-like formation of invaded cells.
Figure 8
Figure 8
Purified h HSS1 inhibits HUVEC tube formation in a concentration-related manner. HUVEC growing on top of matrigel were treated with different concentrations of purified hHSS1 or vehicle control (PBS). Cells were pre-treated with hHSS1-His protein or vehicle control for 3 h before plating on top of matrigel. After 8 h, cells were stained with crystal violet and tube formation was evaluated. Images (100x, magnification) are representative of two independent experiments done in duplicate. A and C) Inhibitory effect of purified hHSS1-His on tube formation using 500 nM and 200 nM of hHSS1 protein, respectively. B and D) Vehicle control was diluted following the protein dilution scheme.
Figure 9
Figure 9
h HSS1 expression analysis in GBM from the TCGA dataset. A) Correlation analysis between hHSS1 and BRCA2 expression (r = −0.224, P < 0.0005). B) Log2-transformed gene expression levels for selected genes between high and low-hHSS1 expression cohorts. Mean gene expression levels between cohorts were compared by two-tailed Student's t-test, P < 0.01. P values - HSS1 lo vs. HSS1 hi : (hHSS1, P < 6.55e−98), (ADAMTS1, P < 0.014), (BRCA2, P < 0.00006), Endostatin (COL18A1), P < 0.048).

References

    1. Wang X, Gong W, Liu Y, Yang Z, Zhou W, Wang M, Yang Z, Wen J, Hu R. Molecular cloning of a novel secreted peptide, INM02, and regulation of its expression by glucose. J Endocrinol. 2009;202(3):355–364. doi: 10.1677/JOE-09-0086. - DOI - PubMed
    1. Christianson JC, Olzmann JA, Shaler TA, Sowa ME, Bennett EJ, Richter CM, Tyler RE, Greenblatt EJ, Harper JW, Kopito RR. Defining human ERAD networks through an integrative mapping strategy. Nat Cell Biol. 2011;14(1):93–105. doi: 10.1038/ncb2383. - DOI - PMC - PubMed
    1. Xu B, Hsu PK, Stark KL, Karayiorgou M, Gogos JA. Derepression of a neuronal inhibitor due to miRNA dysregulation in a schizophrenia-related microdeletion. Cell. 2013;152(1–2):262–275. doi: 10.1016/j.cell.2012.11.052. - DOI - PMC - PubMed
    1. Junes-Gill KS, Gallaher TK, Gluzman-Poltorak Z, Miller JD, Wheeler CJ, Fan X, Basile LA. hHSS1: a novel secreted factor and suppressor of glioma growth located at chromosome 19q13.33. J Neurooncol. 2011;102(2):197–211. doi: 10.1007/s11060-010-0314-6. - DOI - PMC - PubMed
    1. Moore K, Kim L. Primary Brain Tumors: Characteristics, Pratical Diagnostic and Treatment Approaches. In: Ray SK, editor. Glioblastoma: Molecular Mechanisms of Pathogenesis and Current Therapeutic Strategies. 2010. pp. 43–75.
Pre-publication history
    1. The pre-publication history for this paper can be accessed here:http://www.biomedcentral.com/1471-2407/14/920/prepub

Publication types

MeSH terms