

Unraveling the chromosome 17 patterns of FISH in interphase nuclei: an in-depth analysis of the HER2 amplicon and chromosome 17 centromere by karyotyping, FISH and M-FISH in breast cancer cells
- PMID: 25481507
- PMCID: PMC4295336
- DOI: 10.1186/1471-2407-14-922
Unraveling the chromosome 17 patterns of FISH in interphase nuclei: an in-depth analysis of the HER2 amplicon and chromosome 17 centromere by karyotyping, FISH and M-FISH in breast cancer cells
Abstract
Background: In diagnostic pathology, HER2 status is determined in interphase nuclei by fluorescence in situ hybridization (FISH) with probes for the HER2 gene and for the chromosome 17 centromere (CEP17). The latter probe is used as a surrogate for chromosome 17 copies, however chromosome 17 (Chr17) is frequently rearranged. The frequency and type of specific structural Chr17 alterations in breast cancer have been studied by using comparative genomic hybridization and spectral karyotyping, but not fully detailed. Actually, balanced chromosome rearrangements (e.g. translocations or inversions) and low frequency mosaicisms are assessable on metaphases using G-banding karyotype and multicolor FISH (M-FISH) only.
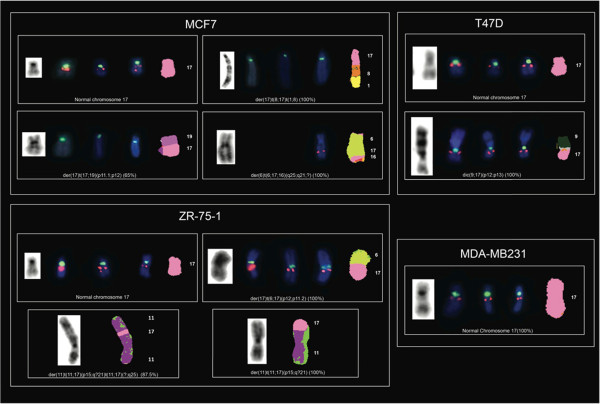
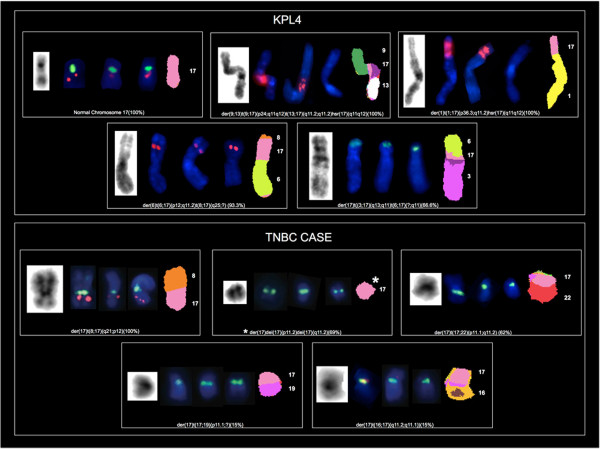
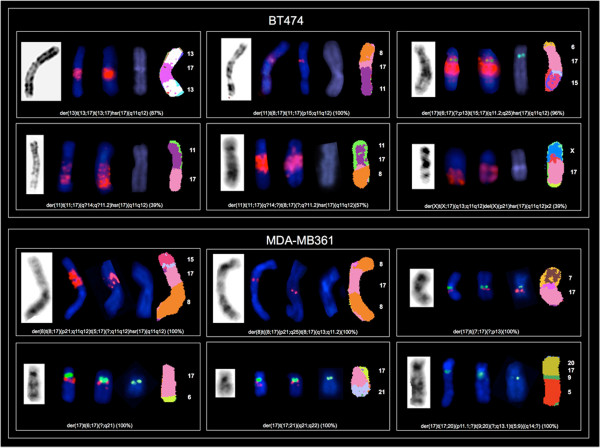
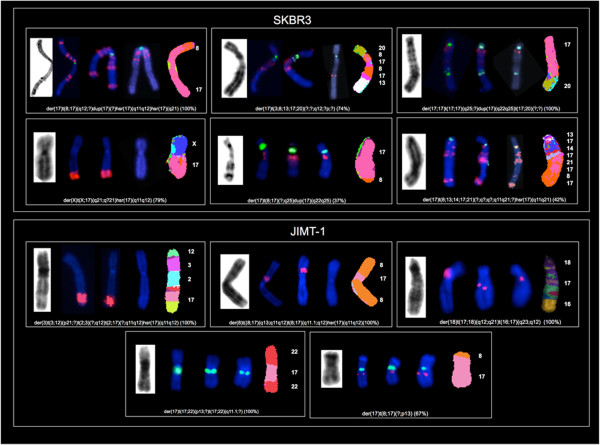
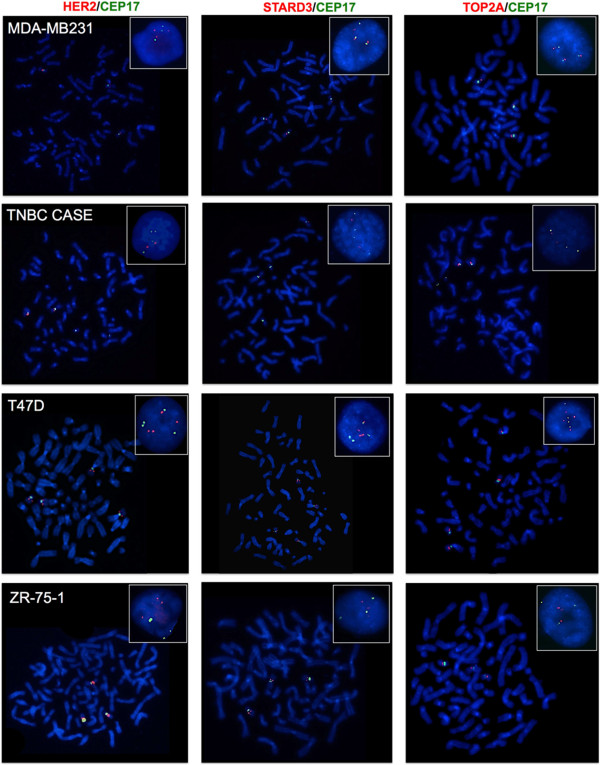
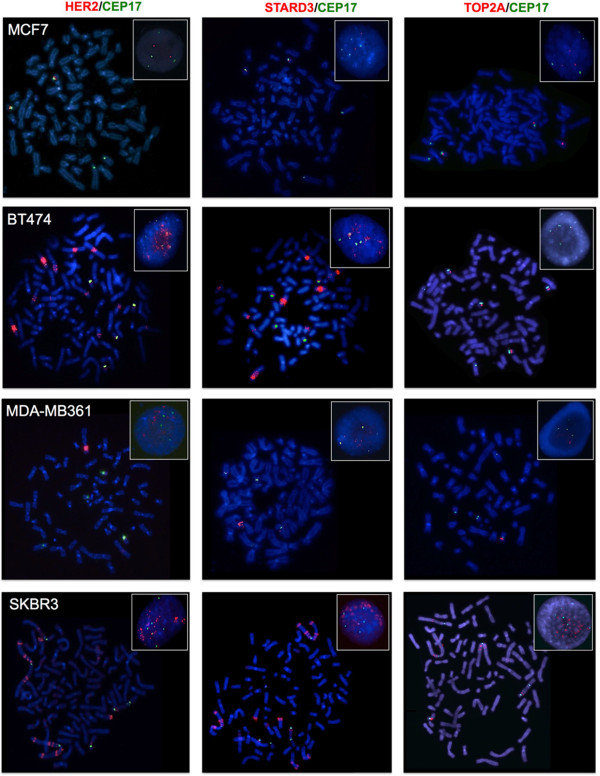
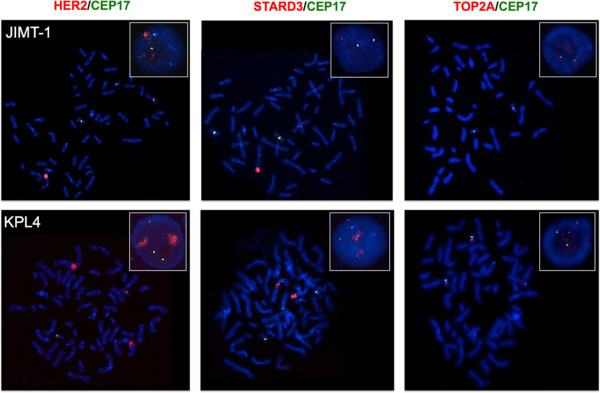
Methods: We sought to elucidate the CEP17 and HER2 FISH patterns of interphase nuclei by evaluating Chr17 rearrangements in metaphases of 9 breast cancer cell lines and a primary culture from a triple negative breast carcinoma by using G-banding, FISH and M-FISH.
Results: Thirty-nine rearranged chromosomes containing a portion of Chr17 were observed. Chromosomes 8 and 11 were the most frequent partners of Chr17 translocations. The lowest frequency of Chr17 abnormalities was observed in the HER2-negative cell lines, while the highest was observed in the HER2-positive SKBR3 cells. The MDA-MB231 triple negative cell line was the sole to show only non-altered copies of Chr17, while the SKBR3, MDA-MB361 and JIMT-1 HER2-positive cells carried no normal Chr17 copies. True polysomy was observed in MDA-MB231 as the only Chr17 alteration. In BT474 cells polysomy was associated to Chr17 structural alterations. By comparing M-FISH and FISH data, in 8 out of 39 rearranged chromosomes only CEP17 signals were detectable, whereas in 14 rearranged chromosomes HER2 and STARD3 genes were present without CEP17 signals. HER2 and STARD3 always co-localized on the same chromosomes and were always co-amplified, whereas TOP2A also mapped to different derivatives and was co-amplified with HER2 and STARD3 on SKBR3 cells only.
Conclusion: The high frequency of complex Chr17 abnormalities suggests that the interpretation of FISH results on interphase nuclei using a dual probe assay to assess gene amplification should be performed "with caution", given that CEP17 signals are not always indicative of normal unaltered or rearranged copies of Chr17.
Figures
Similar articles
-
Co-amplification of the HER2 gene and chromosome 17 centromere: a potential diagnostic pitfall in HER2 testing in breast cancer.Breast Cancer Res Treat. 2012 Apr;132(3):925-35. doi: 10.1007/s10549-011-1642-8. Epub 2011 Jun 23. Breast Cancer Res Treat. 2012. PMID: 21698407
-
Chromosome 17 centromere duplication and responsiveness to anthracycline-based neoadjuvant chemotherapy in breast cancer.Neoplasia. 2014 Oct 23;16(10):861-7. doi: 10.1016/j.neo.2014.08.012. eCollection 2014 Oct. Neoplasia. 2014. PMID: 25379022 Free PMC article. Clinical Trial.
-
Therapeutic strategies in male breast cancer: clinical implications of chromosome 17 gene alterations and molecular subtypes.Breast. 2013 Dec;22(6):1066-71. doi: 10.1016/j.breast.2013.08.008. Epub 2013 Sep 27. Breast. 2013. PMID: 24080492
-
HER2 in situ hybridization in breast cancer: clinical implications of polysomy 17 and genetic heterogeneity.Mod Pathol. 2014 Jan;27(1):4-18. doi: 10.1038/modpathol.2013.103. Epub 2013 Jun 28. Mod Pathol. 2014. PMID: 23807776 Review.
-
The applications of FISH in tumor pathology.Adv Clin Path. 1999 Oct;3(4):111-8. Adv Clin Path. 1999. PMID: 10936888 Review.
Cited by
-
Metastatic Lymph Node 64 (MLN64) Expression in Gastric Cancer: The Clinical and Molecular Implications in Drug Resistance.Cancer Genomics Proteomics. 2024 Jan-Feb;21(1):30-40. doi: 10.21873/cgp.20427. Cancer Genomics Proteomics. 2024. PMID: 38151289 Free PMC article.
-
Quantitative, in situ analysis of mRNAs and proteins with subcellular resolution.Sci Rep. 2017 Nov 28;7(1):16459. doi: 10.1038/s41598-017-16492-1. Sci Rep. 2017. PMID: 29184166 Free PMC article.
-
Prognostic significance of equivocal human epidermal growth factor receptor 2 results and clinical utility of alternative chromosome 17 genes in patients with invasive breast cancer: A cohort study.Cancer. 2017 Apr 1;123(7):1115-1123. doi: 10.1002/cncr.30460. Epub 2016 Nov 28. Cancer. 2017. PMID: 27893937 Free PMC article.
-
The Dilemma of HER2 Double-equivocal Breast Carcinomas: Genomic Profiling and Implications for Treatment.Am J Surg Pathol. 2018 Sep;42(9):1190-1200. doi: 10.1097/PAS.0000000000001100. Am J Surg Pathol. 2018. PMID: 29975246 Free PMC article.
-
Monosomy of chromosome 17 in breast cancer during interpretation of HER2 gene amplification.Am J Cancer Res. 2015 Jun 15;5(7):2212-21. eCollection 2015. Am J Cancer Res. 2015. PMID: 26328251 Free PMC article.
References
-
- Orsetti B, Nugoli M, Cervera N, Lasorsa L, Chuchana P, Ursule L, Nguyen C, Redon R, du Manoir S, Rodriguez C, Theillet C. Genomic and expression profiling of chromosome 17 in breast cancer reveals complex patterns of alterations and novel candidate genes. Cancer Res. 2004;64(18):6453–6460. doi: 10.1158/0008-5472.CAN-04-0756. - DOI - PubMed
Pre-publication history
-
- The pre-publication history for this paper can be accessed here:http://www.biomedcentral.com/1471-2407/14/922/prepub
Publication types
MeSH terms
Substances
LinkOut - more resources
Full Text Sources
Other Literature Sources
Research Materials
Miscellaneous
