. 2015 Feb:79:264-74.
doi: 10.1016/j.yjmcc.2014.11.022. Epub 2014 Dec 3.

Independent modulation of contractile performance by cardiac troponin I Ser43 and Ser45 in the dynamic sarcomere

Affiliations

Independent modulation of contractile performance by cardiac troponin I Ser43 and Ser45 in the dynamic sarcomere

Sarah E Lang et al. J Mol Cell Cardiol. 2015 Feb.

Abstract

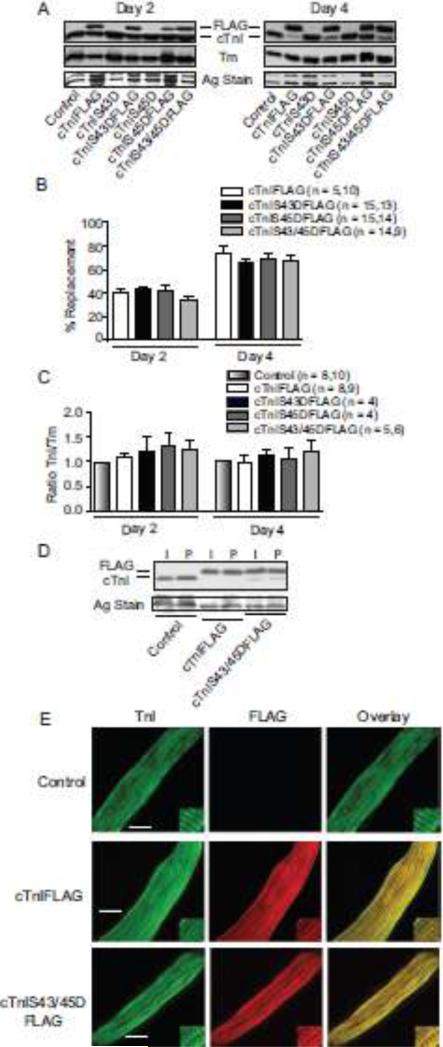
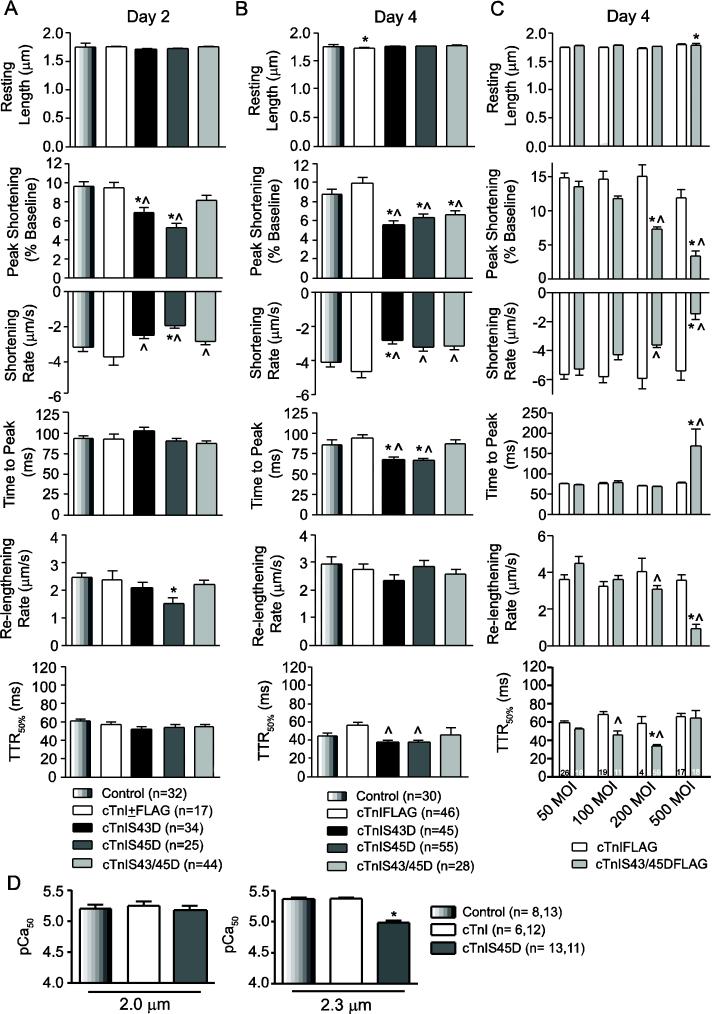
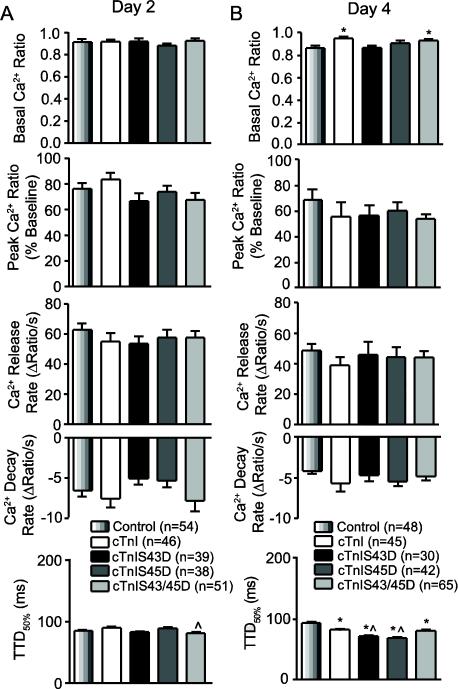
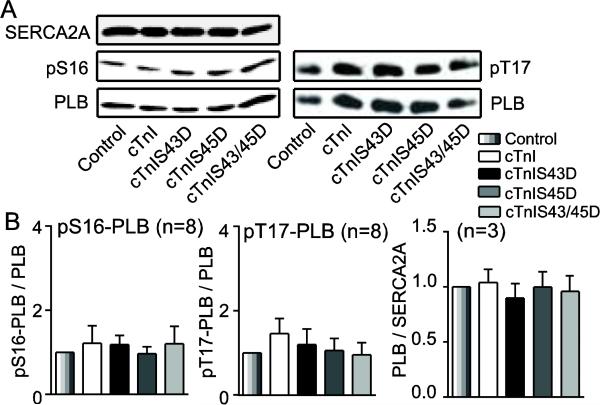
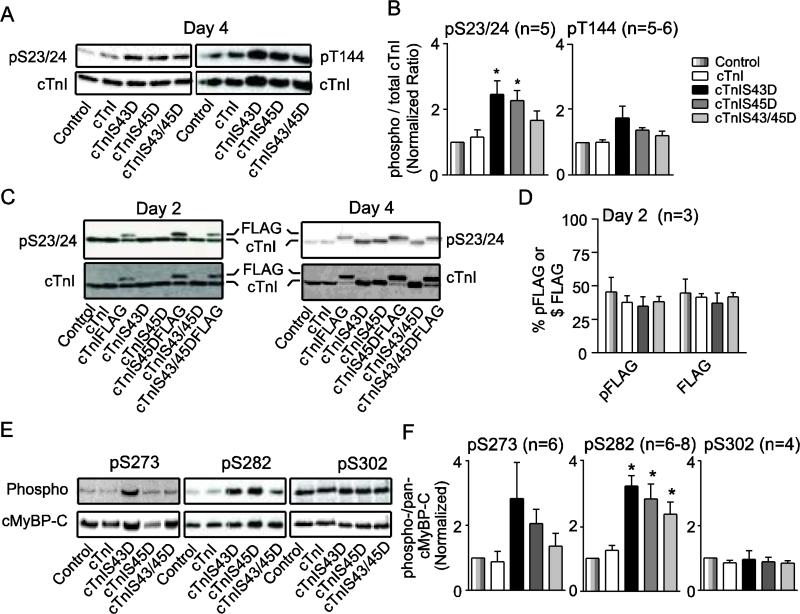
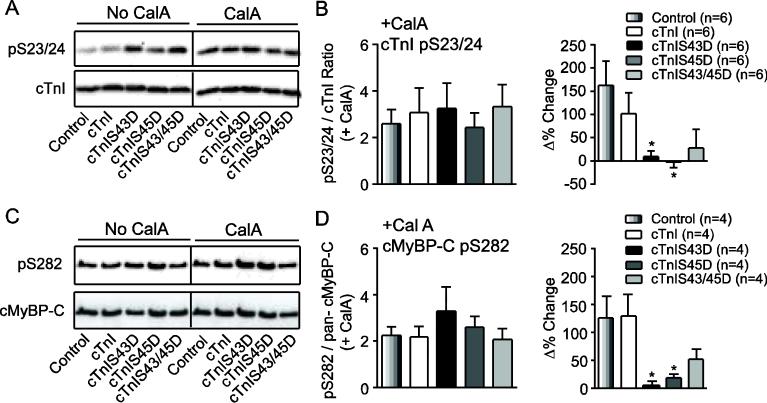
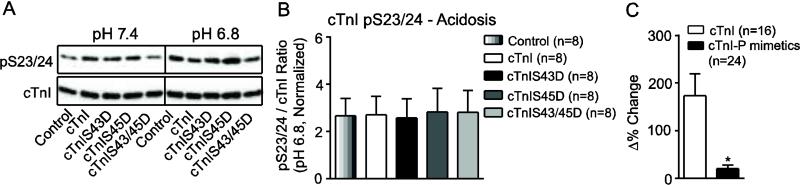
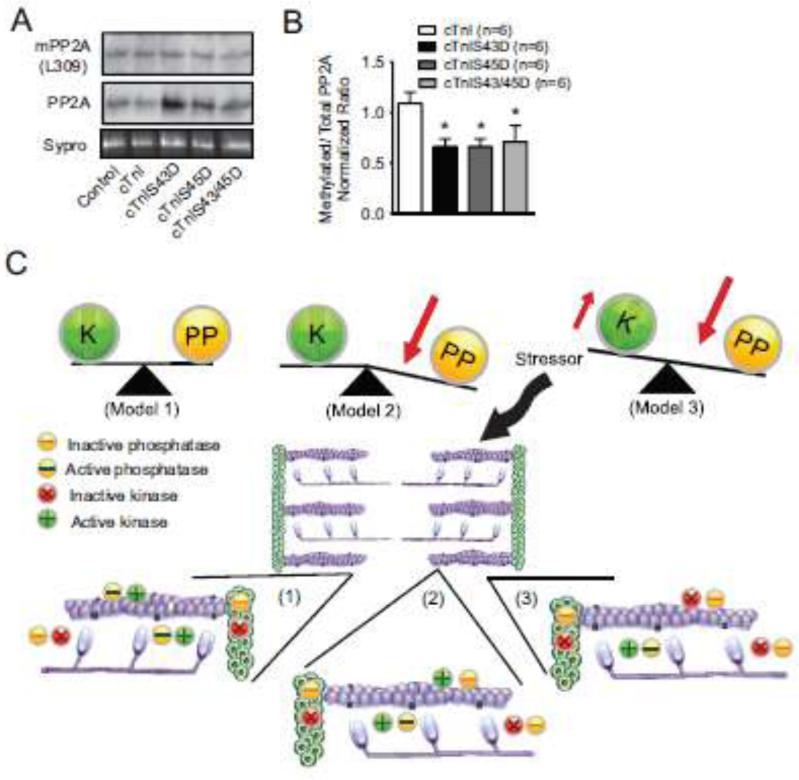
Protein kinase C (PKC) targets cardiac troponin I (cTnI) S43/45 for phosphorylation in addition to other residues. During heart failure, cTnI S43/45 phosphorylation is elevated, and yet there is ongoing debate about its functional role due, in part, to the emergence of complex phenotypes in animal models. The individual functional influences of phosphorylated S43 and S45 also are not yet known. The present study utilizes viral gene transfer of cTnI with phosphomimetic S43D and/or S45D substitutions to evaluate their individual and combined influences on function in intact adult cardiac myocytes. Partial replacement (≤40%) with either cTnIS43D or cTnIS45D reduced the amplitude of contraction, and cTnIS45D slowed contraction and relaxation rates, while there were no significant changes in function with cTnIS43/45D. More extensive replacement (≥70%) with cTnIS43D, cTnIS45D, and cTnIS43/45D each reduced the amplitude of contraction. Additional experiments also showed cTnIS45D reduced myofilament Ca(2+) sensitivity of tension. At the same time, shortening rates returned toward control values with cTnIS45D and the later stages of relaxation also became accelerated in myocytes expressing cTnIS43D and/or S45D. Further studies demonstrated this behavior coincided with adaptive changes in myofilament protein phosphorylation. Taken together, the results observed in myocytes expressing cTnIS43D and/or S45D suggest these 2 residues reduce function via independent mechanism(s). The changes in function associated with the onset of adaptive myofilament signaling suggest the sarcomere is capable of fine tuning PKC-mediated cTnIS43/45 phosphorylation and contractile performance. This modulatory behavior also provides insight into divergent phenotypes reported in animal models with cTnI S43/45 phosphomimetic substitutions.

Keywords: Myocyte; Myofilament; Phosphorylation; Protein kinase C; Troponin.


Figures

FIGURE 1
FIGURE 1. Protein expression, thin filament stoichiometry, and sarcomere incorporation of cTnI phosphomimetics 2 and 4 days after gene transfer
A. Representative immunoblots show protein expression of cTnI and cTnI phosphomimetics (cTnIS43D, cTnIS45D, cTnIS43/45D) with and without FLAG tags. The FLAG- and non-tagged cTnI (upper panel), Tm expression (middle panel), and a silver (Ag)-stained gel band (lower panel) are shown to indicate protein loading in each lane. B. Quantitative analysis of the percent replacement with individual FLAG-tagged constructs 2 (left) and 4 (right) days after gene transfer. The number of individual hearts analyzed is indicated by the n value in this panel and panel C. Results in both panels were compared with a 1-way ANOVA (p>0.05) for statistical comparisons. C. Quantitative analysis of thin filament stoichiometry based on the cTnI/Tm expression ratio in myocytes expressing FLAG-tagged cTnI substitutions. Ratios were normalized to time-matched controls for each phosphomimetic cTnI (see Methods) at 2 (left) and 4 (right) days post-gene transfer. Comparable results were obtained for non-tagged constructs (not shown). D. Representative Western blot showing comparable replacement of endogenous cTnI with each construct in intact (I) and permeabilized (P) myocytes. E. Representative confocal projection images for control, cTnIFLAG- and cTnIS43/45DFLAG-expressing cardiac myocytes immunostained for TnI and FITC (left; bar = 10 μm), FLAG and Texas Red (middle), plus the overlay (right). Myocytes expressing cTnIS43DFLAG and cTnIS45DFLAG produced comparable IHC patterns (not shown).
FIGURE 2
FIGURE 2. Contractile function in cardiac myocytes 2 (A) and 4 (B, C) days after cTnI gene transfer
A. Quantitative analysis of basal contractile function in cTnIS43D-, cTnIS45D-, TnIS43/45D-, cTnI+FLAG-expressing myocytes, and time-matched controls 2 days post-gene transfer. Resting sarcomere length, peak shortening amplitude (%basal), shortening rate and time to peak (TTP), re-lengthing rate and time to 50% re-lengthening (TTR50%) are shown. The legend for each panel includes sample n. Values for cTnI and cTnIFLAG were pooled based on initial studies showing no statistical differences between these groups (p>0.05). B. Quantitative analysis of sarcomere shortening and re-lengthening in intact myocytes 4 days after gene transfer. Myocytes were treated with 200 MOI of recombinant cTnIS43D, cTnIS45D, and cTnIS43/45D adenovirus and compared to non-treated controls (*p<0.05) and myocytes expressing cTnIFLAG (^p<0.05) by 1-way ANOVA and post-hoc analyses in panels A, B and D. C. A quantitative comparison of functional measurements made in myocytes 4 days post-gene transfer of 50-500 MOI cTnIFLAG or cTnIS43/45DFLAG. Statistical comparisons were performed using a 2-way ANOVA and post-hoc Tukey's test (*p<0.05 vs. cTnIFLAG; ^p<0.05 vs. 50 MOI cTnIS43/45DFLAG). D. Analysis of pCa50 measured in permeabilized myocytes at a SL of 2.0 and 2.3 µm compared to non-treated controls (*p<0.05, 1-way ANOVA). Myocytes expressing cTnIS45D were evaluated based on their significant impact on shortening amplitude. Maximum tension (P0) at each SL was not different (p>0.05) among myocyte groups (Po kN/m2; SL 2.0 μm: Con = 6.07±0.81; cTnI = 6.51±0.82; cTnIS45D = 7.81±1.33; SL 2.3 μm: Con = 11.17±1.15; cTnI = 8.96±0.71; cTnIS45D = 9.17±1.16).
FIGURE 3
FIGURE 3. Quantitative analysis of Ca2+ handling in electrically paced, Fura-2AM-loaded adult myocytes 2 (A) and 4 (B) days after gene transfer
The basal Ca2+ ratio, peak Ca2+ transient amplitude (% baseline), rates of Ca2+ release and re-uptake, and time to 50% decay (TTD50%) were evaluated for each Ca2+ transient. Statistical differences between cTnI phosphomimetics and controls (*p<0.05; ANOVA) and/or cTnI-expressing myocytes (^p<0.05) are indicated in each panel. Sample n is shown in each legend.
FIGURE 4
FIGURE 4. Representative immunoblots and quantitative analysis of proteins contributing to Ca2+ uptake into the sarcoplasmic reticulum (SR)
A. Representative immunoblots for SERCA2A expression (upper left), pS16-PLB (middle left), and pT17-PLB (upper right) relative to total PLB expression (lower panels). B. Quantitative analysis of pS16-PLB (left) and pT17-PLB (middle) relative to total PLB expression, and PLB/SERCA2A ratio (right). The ratios in each group were normalized to the appropriate control values and compared by ANOVA (p>0.05). Sample n is shown in the title for each panel.
FIGURE 5
FIGURE 5. Analysis of myofilament protein phosphorylation in myocytes expressing wild type and phosphomimetic cTnI
A. Representative pS23/24 (upper left) and pT144 (upper right) relative to total cTnI expression (lower panels) detected by immunoblot 4 days after gene transfer. B. Quantitative analysis of pS23/24- and pT144-cTnI detected in cTnI immunoblots. The normalized ratio of phosphorylated to total cTnI in each group was compared by ANOVA in both panels (*p<0.05 vs control). The legend shown to the right of this panel applies to panels B, D and F, with sample n indicated in each panel. C. Representative immunoblots showing pS23/24 for myocytes expressing FLAG-tagged cTnI constructs 2 and 4 days after gene transfer. D. Quantitative analysis of the %pS23/24 present as FLAG (% pFLAG) compared to % cTnIFLAG (%FLAG) expression relative to total cTnI 2 days after gene transfer (p>0.05 by ANOVA). E. Representative immunoblots showing cMyBP-C pS273 (upper left), pS282 (upper middle), pS302 (upper right) and total cMyBP-C protein expression (lower panels) in adult myocytes 4 days after gene transfer. F. Quantitative analysis of the phospho-/total cMyBP-C ratios for pS273-, pS282-, and pS302-cMyBP-C. Normalized phosphorylation ratios for these cMyBP-C residues were calculated as described in panel B.
FIGURE 6
FIGURE 6. Representative immunoblot (A, C) and quantitative (B, D) analyses of cTnI pS23/24 (A, B) and cMyBP-C pS282 (C,D) in day 4 adult myocytes treated with the phosphatase inhibitor, calyculin A (CalA, 10 nM)
A. Representative immunoblot comparing cTnI pS23/24 in the absence and presence of CalA. The black vertical line in this panel and panel C indicates separation by additional lanes on the same immunoblot. B. Quantitative analysis of the normalized ratio of cTnI pS23/24 relative to total cTnI. The change in phosphorylation observed in the presence versus absence of CalA is expressed as the Δ% change (right panel). In this panel and panel D, quantitative results were compared by ANOVA (*p<0.05 vs. control), and sample n is provided in each legend. C. Representative immunoblot showing cMyBP-C pS282 in the absence and presence of CalA (day 4). D. Quantitative analysis of cMyBP-C pS282 after CalA (left), and the Δ% change in phosphorylation produced by CalA (right panel). The pS282 results are expressed as a normalized fraction of total cMyBP-C.
FIGURE 7
FIGURE 7. Representative immunoblot (A) and quantitative analyses (B,C) of cTnI pS23/24 in response to acidosis (pH 6.8)
A. Representative immunoblot comparing cTnI pS23/24 in the presence and absence of acidosis treatment in myocytes 4 days post-gene transfer. The vertical black line indicates additional lanes separated samples on the same blot. B. Quantitative analysis of the normalized cTnI pS23/24 / total cTnI ratio. Results were compared by 1-way ANOVA (p>0.05). C. Analysis of the Δ% change in cTnI pS23/24 when results from control and cTnI-expressing myocytes were pooled and compared to the pooled set of cTnI-phosphomimetic-expressing myocytes (cTnIS43D, cTnIS45D, cTnIS43/45D) using a Student's unpaired t-test (*p<0.05).
FIGURE 8
FIGURE 8. Protein phosphatase 2A (PP2A) expression (A,B) and a working model of adaptive phosphorylation (C)
A. Representative immunoblot showing methylated (upper), total PP2A (middle) and a Sypro-stained blot band (lower panel) to indicate protein load). B. Quantitative analysis of the normalized ratio of methylated PP2A relative to total PP2A. Values obtained in myocytes expressing phosphomimetic cTnI were compared to cTnI-expressing myocytes using a 1-way ANOVA and post-hoc tests (*p<0.05 vs. cTnI). C. Working model of the kinase and phosphatase activity balance in the sarcomere under basal conditions (model 1) and the changes to this balance during adaptive myofilament protein phosphorylation (models 2 and 3) produced by phosphomimetic cTnI and acidosis. An expanded portion of the sarcomere is included for each model to demonstrate the relative myofilament distribution and/or activity (active vs. inactive) of kinases and phosphatases. The legend explaining inactive and active kinases and phosphatases is shown below model 1. Results from the present study provide evidence to support model 2 (reduced phosphatase activity), but kinase activity also may contribute to this adaptive response (model 3).

Similar articles

Cited by

References

    1. Solaro RJ, Henze M, Kobayashi T. Integration of troponin I phosphorylation with cardiac regulatory networks. Circ Res. 2013;112:355–366. - PMC - PubMed
    1. Solaro RJ, Kobayashi T. Protein phosphorylation and signal transduction in cardiac thin filaments. J Biol Chem. 2011;286:9935–9940. - PMC - PubMed
    1. Layland J, Solaro RJ, Shah AM. Regulation of cardiac contractile function by troponin I phosphorylation. Cardiovasc Res. 2005;66:12–21. - PubMed
    1. Westfall MV. Post-translational modification of troponin. In: Jin J-P, editor. Troponin: Regulator of muscle contraction. Nova Science; New York: 2013. pp. 163–203.
    1. Yasuda S, Coutu P, Sadayappan S, Robbins J, Metzger JM. Cardiac transgenic and gene transfer strategies converge to support an important role for troponin I in regulating relaxation in cardiac myocytes. Circ Res. 2007;101:377–386. - PubMed

Publication types