

Proteomic analysis of zoledronic-acid resistant prostate cancer cells unveils novel pathways characterizing an invasive phenotype
- PMID: 25481874
- PMCID: PMC4467152
- DOI: 10.18632/oncotarget.2694
Proteomic analysis of zoledronic-acid resistant prostate cancer cells unveils novel pathways characterizing an invasive phenotype
Abstract
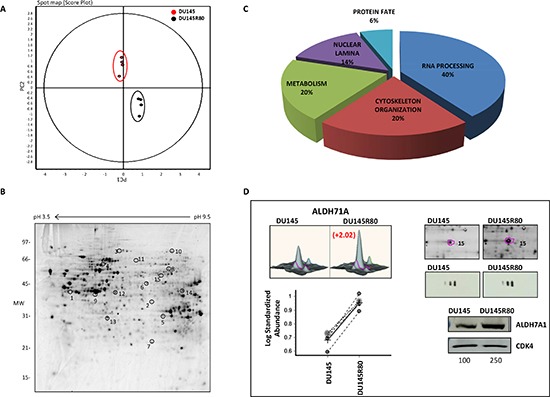
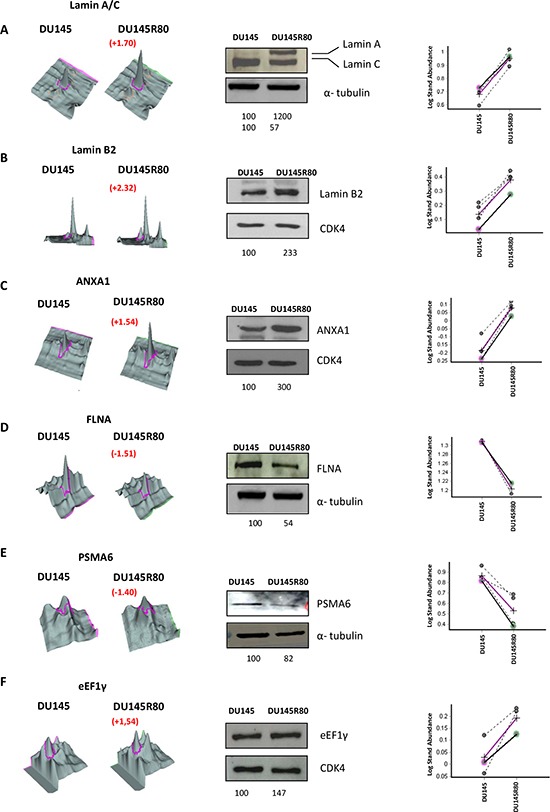
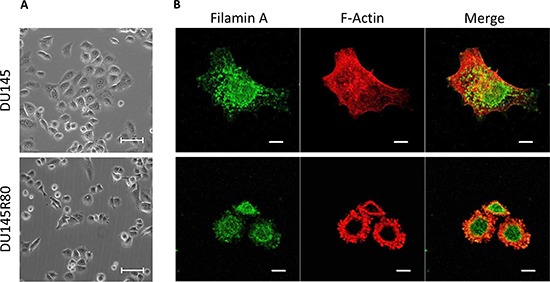
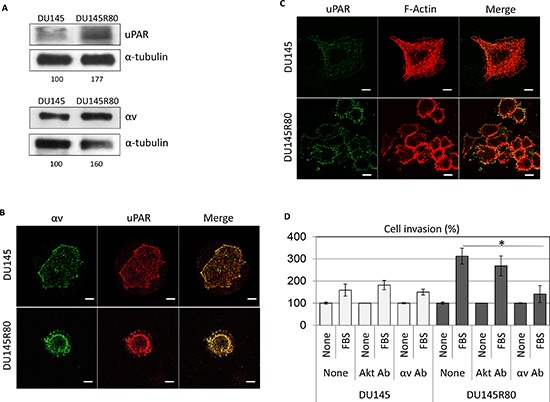
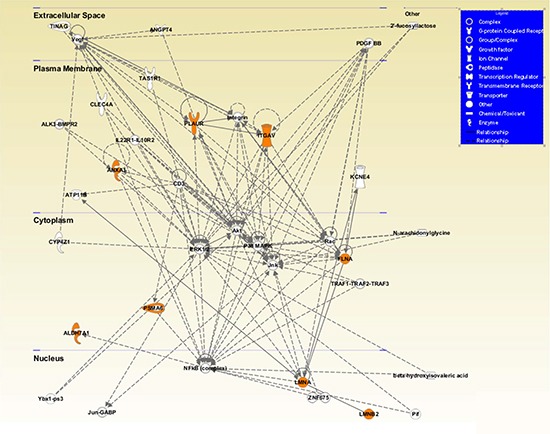
Proteomic analysis identified differentially expressed proteins between zoledronic acid-resistant and aggressive DU145R80 prostate cancer (PCa) cells and their parental DU145 cells. Ingenuity Pathway Analysis (IPA) showed a strong relationship between the identified proteins within a network associated with cancer and with homogeneous cellular functions prevalently related with regulation of cell organization, movement and consistent with the smaller and reduced cell-cell contact morphology of DU145R80 cells. The identified proteins correlated in publically available human PCa genomic data with increased tumor expression and aggressiveness. DU145R80 exhibit also a clear increase of alpha-v-(αv) integrin, and of urokinase receptor (uPAR), both included within the same network of the identified proteins. Interestingly, the actin-rich structures localized at the cell periphery of DU145R80 cells are rich of Filamin A, one of the identified proteins and uPAR which, in turn, co-localizes with αv-integrin, in podosomes and/or invadopodia. Notably, the invasive feature of DU145R80 may be prevented by blocking anti-αv antibody. Overall, we unveil a signaling network that physically links the interior of the nucleus via the cytoskeleton to the extracellular matrix and that could dictate PCa aggressiveness suggesting novel potential prognostic markers and therapeutic targets for PCa patients.
Keywords: cytoskeleton organization; prostate cancer; urokinase receptor (uPAR); zoledronic acid; αv integrin.
Figures
Similar articles
-
Large oncosomes overexpressing integrin alpha-V promote prostate cancer adhesion and invasion via AKT activation.J Exp Clin Cancer Res. 2019 Jul 18;38(1):317. doi: 10.1186/s13046-019-1317-6. J Exp Clin Cancer Res. 2019. PMID: 31319863 Free PMC article.
-
Annexin A1 is involved in the acquisition and maintenance of a stem cell-like/aggressive phenotype in prostate cancer cells with acquired resistance to zoledronic acid.Oncotarget. 2015 Sep 22;6(28):25076-92. doi: 10.18632/oncotarget.4725. Oncotarget. 2015. PMID: 26312765 Free PMC article.
-
Acquired resistance to zoledronic acid and the parallel acquisition of an aggressive phenotype are mediated by p38-MAP kinase activation in prostate cancer cells.Cell Death Dis. 2013 May 23;4(5):e641. doi: 10.1038/cddis.2013.165. Cell Death Dis. 2013. PMID: 23703386 Free PMC article.
-
Clinical efficacy and safety of zoledronic acid in prostate and breast cancer.Expert Rev Anticancer Ther. 2009 Sep;9(9):1211-8. doi: 10.1586/era.09.95. Expert Rev Anticancer Ther. 2009. PMID: 19761424 Review.
-
Tissue proteomics studies in the investigation of prostate cancer.Expert Rev Proteomics. 2018 Jul;15(7):593-611. doi: 10.1080/14789450.2018.1491796. Epub 2018 Jul 16. Expert Rev Proteomics. 2018. PMID: 29939814 Review.
Cited by
-
Proteomic characterization of peroxisome proliferator-activated receptor-γ (PPARγ) overexpressing or silenced colorectal cancer cells unveils a novel protein network associated with an aggressive phenotype.Mol Oncol. 2016 Oct;10(8):1344-62. doi: 10.1016/j.molonc.2016.07.006. Epub 2016 Jul 25. Mol Oncol. 2016. PMID: 27499265 Free PMC article.
-
Synergistic antitumor interaction of valproic acid and simvastatin sensitizes prostate cancer to docetaxel by targeting CSCs compartment via YAP inhibition.J Exp Clin Cancer Res. 2020 Oct 8;39(1):213. doi: 10.1186/s13046-020-01723-7. J Exp Clin Cancer Res. 2020. PMID: 33032653 Free PMC article.
-
Large oncosomes overexpressing integrin alpha-V promote prostate cancer adhesion and invasion via AKT activation.J Exp Clin Cancer Res. 2019 Jul 18;38(1):317. doi: 10.1186/s13046-019-1317-6. J Exp Clin Cancer Res. 2019. PMID: 31319863 Free PMC article.
-
The Multifaceted Role of Aldehyde Dehydrogenases in Prostate Cancer Stem Cells.Cancers (Basel). 2021 Sep 20;13(18):4703. doi: 10.3390/cancers13184703. Cancers (Basel). 2021. PMID: 34572930 Free PMC article. Review.
-
Proteomic screening identifies calreticulin as a miR-27a direct target repressing MHC class I cell surface exposure in colorectal cancer.Cell Death Dis. 2016 Feb 25;7(2):e2120. doi: 10.1038/cddis.2016.28. Cell Death Dis. 2016. PMID: 26913609 Free PMC article.
References
-
- Agarwal N, Di Lorenzo G, Sonpavde G, Bellmunt J. New agents for prostate cancer. Ann Oncol. 2014;25:1700–1709. - PubMed
-
- Bedolla RG, Wang Y, Asuncion A, Chamie K, Siddiqui S, Mudryj MM, Prihoda TJ, Siddiqui J, Chinnaiyan AM, Mehra R, de Vere White RW, Ghosh PM. Nuclear versus cytoplasmic localization of filamin a in prostate cancer: Immunohistochemical correlation with metastases. Clin Cancer Res. 2009;15:788–796. - PMC - PubMed
-
- Caraglia M, D'Alessandro AM, Marra M, Giuberti G, Vitale G, Viscomi C, Colao A, Prete SD, Tagliaferri P, Tassone P, Budillon A, Venuta S, Abbruzzese A. The farnesyl transferase inhibitor r115777 (zarnestra) synergistically enhances growth inhibition and apoptosis induced on epidermoid cancer cells by zoledronic acid (zometa) and pamidronate. Oncogene. 2004;23:6900–6913. - PubMed
MeSH terms
Substances
LinkOut - more resources
Full Text Sources
Other Literature Sources
Medical
