. 2015 Jun;29(6):1350-9.
doi: 10.1038/leu.2014.341. Epub 2014 Dec 8.

PTPROt-mediated regulation of p53/Foxm1 suppresses leukemic phenotype in a CLL mouse model

Affiliations

PTPROt-mediated regulation of p53/Foxm1 suppresses leukemic phenotype in a CLL mouse model

T Motiwala et al. Leukemia. 2015 Jun.

Abstract

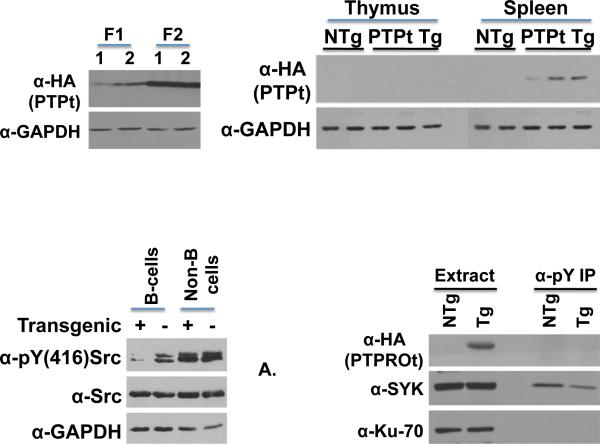
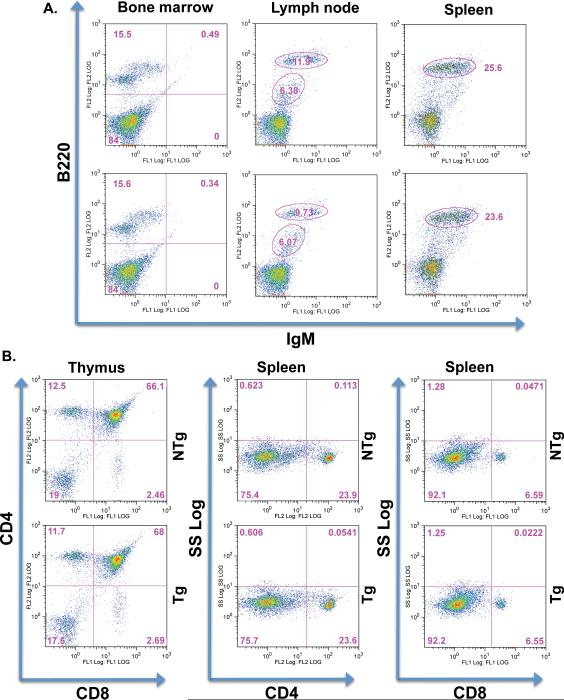
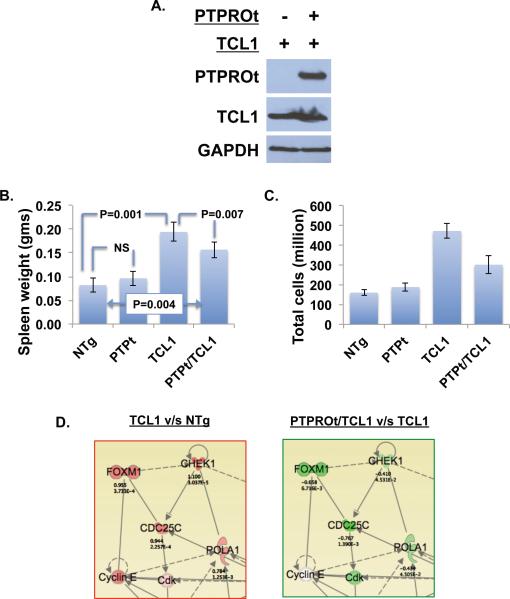
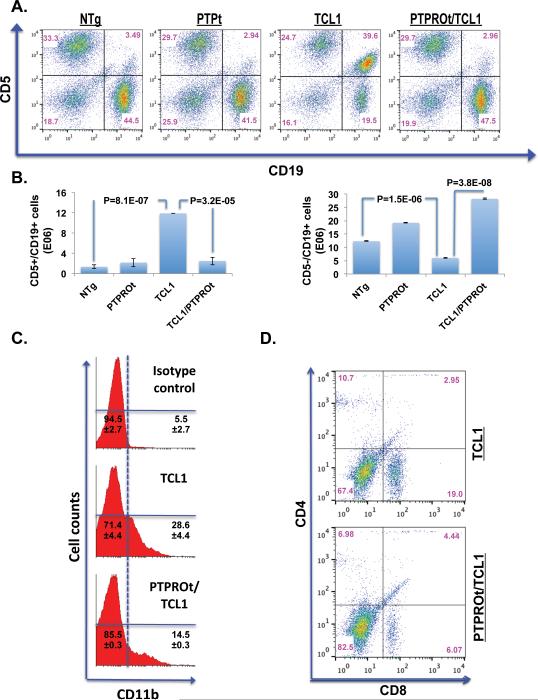
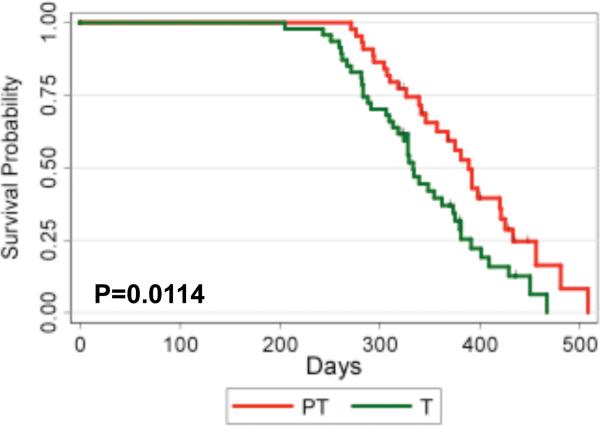
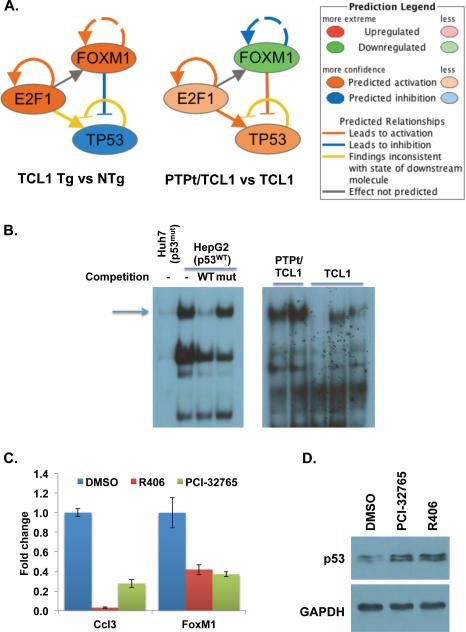
The gene encoding PTPROt (truncated isoform of protein tyrosine phosphatase receptor-type O) is methylated and suppressed in chronic lymphocytic leukemia (CLL). PTPROt exhibits in vitro tumor-suppressor characteristics through the regulation of B-cell receptor (BCR) signaling. Here we generated transgenic (Tg) mice with B-cell-specific expression of PTPROt. Although lymphocyte development is normal in these mice, crossing them with TCL1 Tg mouse model of CLL results in a survival advantage compared with the TCL1 Tg mice. Gene expression profiling of splenic B-lymphocytes before detectable signs of CLL followed by Ingenuity Pathway Analysis revealed that the most prominently regulated functions in TCL1 Tg vs non-transgenic (NTg) and TCL1 Tg vs PTPROt/TCL1 double Tg are the same and also biologically relevant to this study. Further, enhanced expression of the chemokine Ccl3, the oncogenic transcription factor Foxm1 and its targets in TCL1 Tg mice were significantly suppressed in the double Tg mice, suggesting a protective function of PTPROt against leukemogenesis. This study also showed that PTPROt-mediated regulation of Foxm1 involves activation of p53, a transcriptional repressor of Foxm1, which is facilitated through suppression of BCR signaling. These results establish the in vivo tumor-suppressive function of PTPROt and identify p53/Foxm1 axis as a key downstream effect of PTPROt-mediated suppression of BCR signaling.


Figures

Figure 1
Figure 1. Characterization of PTPROt Tg mice
Western blot analysis of whole cell extracts of total cells from the spleen of the two founders F1 and F2 (A) and from thymus and spleen of founder F2 (B) using α-HA (HA-tagged PTPROt) and α-GAPDH (normalizer). (C) Western blot analysis of whole cell extracts of CD19 sorted B-cells and non-B-cells from spleens using α-pY(416)Src (active Src/Lyn), α-Src (total Src) and GAPDH (normalizer). (D) Western blot analysis of whole cell extracts and phosphotyrosine enriched polypeptides from CD19 sorted spleen B-cells using α-HA (HA-tagged PTPROt), α-SYK (spleen tyrosine kinase) and α-Ku-70 (normalizer).
Figure 2
Figure 2. Lymphocyte development in 7-week old PTPROt Tg mice
(A) B-cell development in the bone marrow, lymph nodes and spleen studied by immunostaining for IgM and B220. (B) T-cell development in the thymus and spleen studied by immunostaining for CD4 and CD8.
Figure 3
Figure 3. Effect of TCL1 expression on phenotype of PTPROt Tg mice
(A) Western blot analysis of PTPROt and TCL1 in double Tg mice. (B) Spleen weight and (C) total number of spleen cells in NTg, PTPROt Tg, TCL1 Tg and double Tg mice. (D) Ingenuity pathway analysis of microarray data showing alteration in gene expression when comparing TCL1 Tg vs NTg and PTPROt/TCL1 Tg vs TCL1 Tg. Genes are represented as nodes using various shapes that represent the functional class of the encoded proteins. Solid/dash lines represent direct/indirect protein-protein interactions. Arrowheads represent activation. Red/green colors represent higher/lower expression.
Figure 4
Figure 4. Validation of microarray data
Real-time RT-PCR for (A) FoxM1, (B) Cdc20, (C) Cdc25c and (D) Ccl3 in the CD19 sorted spleen B-cells of NTg, PTPROt Tg, TCL1 Tg and PTPROt/TCL1 double Tg mice. Statistical comparisons for fold change in expression were performed for PTPROt Tg, TCL1 Tg and PTPROt/TCL1 double Tg relative to NTg mice as well as between TCL1 Tg and PTPROt/TCL1 double Tg mice. Only statistically significant p-values (≤ 0.05) are depicted in the figure.
Figure 5
Figure 5. Cellular populations in the spleen of 8-month old TCL1 Tg and PTPROt/TCL1 double Tg mice
(A) Flow cytometric analysis of spleen cells stained with CD5 and CD19 (CLL cells). Flow cytometry data for one representative sample out of three analyzed is presented. (B) Absolute numbers of CD5+/CD19+ (left panel) and CD5−/CD19+ (right panel) cells in the four groups of mice analyzed in (A). Data represents mean from 3 samples ± SD. (C) Flow cytometric analysis of spleen cells stained with CD11b (macrophages/monocytes). Flow cytometry data for one representative sample out of three analyzed is presented. Cell population percentages reflect mean of 3 samples ± SD. (D) Flow cytometric analysis of spleen cells stained with CD4 and CD8 (T-cells). Flow cytometry data for one representative sample out of three analyzed is presented.
Figure 6
Figure 6
Kaplan Meier survival curve for TCL1 Tg (n=47) and PTPROt/TCL1 Tg (n=44) mice.
Figure 7
Figure 7. Mechanism of Foxm1 regulation
(A) IPA predicted interaction among TP53, E2F1 and FOXM1 in TCL1 Tg mice and PTPROt/TCL1 double Tg mice. (B) p53 DNA binding activity in TCL1 Tg and PTPROt/TCL1 double Tg mice. HepG2 (p53WT) and Huh7 (p53mut) were used as positive and negative controls, respectively. (C) Fold change in expression of Ccl3 and Foxm1 as measured by real-time RT-PCR in CD19+ cells isolated from TCL1 Tg mice treated with inhibitors as indicated. (D) Immunoblot analysis of p53 in treated cells. Data is normalized to GAPDH.

Similar articles

Cited by

References

    1. Wiggins RC, Wiggins JE, Goyal M, Wharram BL, Thomas PE. Molecular cloning of cDNAs encoding human GLEPP1, a membrane protein tyrosine phosphatase: characterization of the GLEPP1 protein distribution in human kidney and assignment of the GLEPP1 gene to human chromosome 12p12-p13. Genomics. 1995 May 1;27(1):174–181. - PubMed
    1. Wharram BL, Goyal M, Gillespie PJ, Wiggins JE, Kershaw DB, Holzman LB, et al. Altered podocyte structure in GLEPP1 (Ptpro)-deficient mice associated with hypertension and low glomerular filtration rate. The Journal of clinical investigation. 2000 Nov;106(10):1281–1290. - PMC - PubMed
    1. Beltran PJ, Bixby JL, Masters BA. Expression of PTPRO during mouse development suggests involvement in axonogenesis and differentiation of NT-3 and NGF-dependent neurons. The Journal of comparative neurology. 2003 Feb 17;456(4):384–395. - PubMed
    1. Aguiar RC, Yakushijin Y, Kharbanda S, Tiwari S, Freeman GJ, Shipp MA. PTPROt: an alternatively spliced and developmentally regulated B-lymphoid phosphatase that promotes G0/G1 arrest. Blood. 1999 Oct 1;94(7):2403–2413. - PubMed
    1. Hsu SH, Motiwala T, Roy S, Claus R, Mustafa M, Plass C, et al. Methylation of the PTPRO gene in human hepatocellular carcinoma and identification of VCP as its substrate. Journal of cellular biochemistry. 2013 Aug;114(8):1810–1818. - PMC - PubMed

Publication types

MeSH terms