Interfacing polymeric scaffolds with primary pancreatic ductal adenocarcinoma cells to develop 3D cancer models
- PMID: 25482337
- PMCID: PMC4578550
- DOI: 10.4161/21592527.2014.955386
Interfacing polymeric scaffolds with primary pancreatic ductal adenocarcinoma cells to develop 3D cancer models
Abstract
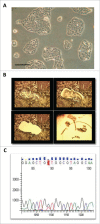
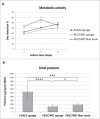
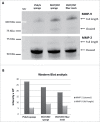
We analyzed the interactions between human primary cells from pancreatic ductal adenocarcinoma (PDAC) and polymeric scaffolds to develop 3D cancer models useful for mimicking the biology of this tumor. Three scaffold types based on two biocompatible polymeric formulations, such as poly(vinyl alcohol)/gelatin (PVA/G) mixture and poly(ethylene oxide terephthalate)/poly(butylene terephthalate) (PEOT/PBT) copolymer, were obtained via different techniques, namely, emulsion and freeze-drying, compression molding followed by salt leaching, and electrospinning. In this way, primary PDAC cells interfaced with different pore topographies, such as sponge-like pores of different shape and size or nanofiber interspaces. The aim of this study was to investigate the influence played by the scaffold architecture over cancerous cell growth and function. In all scaffolds, primary PDAC cells showed good viability and synthesized tumor-specific metalloproteinases (MMPs) such as MMP-2, and MMP-9. However, only sponge-like pores, obtained via emulsion-based and salt leaching-based techniques allowed for an organized cellular aggregation very similar to the native PDAC morphological structure. Differently, these cell clusters were not observed on PEOT/PBT electrospun scaffolds. MMP-2 and MMP-9, as active enzymes, resulted to be increased in PVA/G and PEOT/PBT sponges, respectively. These findings suggested that spongy scaffolds supported the generation of pancreatic tumor models with enhanced aggressiveness. In conclusion, primary PDAC cells showed diverse behaviors while interacting with different scaffold types that can be potentially exploited to create stage-specific pancreatic cancer models likely to provide new knowledge on the modulation and drug susceptibility of MMPs.
Keywords: 2D, Bi-dimensional; 3D, Three-dimensional; BCA, Bicinchoninic acid; BSA, Bovine serum albumin; Dd, double distilled; Ds, double stranded; ECM, Extracellular matrix; G, Gelatin; HRP, Horseradish peroxidase; K-ras, Kirsten rat sarcoma viral oncogene homolog; MMP, Matrix metalloproteinase; PBS, Phosphate buffer saline; PCR, Polymer-chain reaction; PDAC, Pancreatic ductal adenocarcinoma; PEOT/PBT, Poly(ethylene oxide terephthalate)/poly(butylene terephthalate); PVA, Poly(vinyl alcohol); PanIN, Pancreatic intraepithelial neoplasia; Pancreatic adenocarcinoma; Smad4, Mothers against decapentaplegic homolog 4; TME, Tumor microenvironment.; cancer; compression molding; electrospinning; emulsion and freeze-drying; metalloproteinase 2 (MMP-2); metalloproteinase 9 (MMP-9); polyethylene oxide terephthalate (PEOT); polyvinyl alcohol (PVA); scaffold.
Figures


Similar articles
-
3D Models of Pancreatic Ductal Adenocarcinoma via Tissue Engineering.Methods Mol Biol. 2019;1882:81-95. doi: 10.1007/978-1-4939-8879-2_8. Methods Mol Biol. 2019. PMID: 30378046
-
Biological and Tribological Assessment of Poly(Ethylene Oxide Terephthalate)/Poly(Butylene Terephthalate), Polycaprolactone, and Poly (L\DL) Lactic Acid Plotted Scaffolds for Skeletal Tissue Regeneration.Adv Healthc Mater. 2016 Jan 21;5(2):232-43. doi: 10.1002/adhm.201500067. Epub 2015 Nov 25. Adv Healthc Mater. 2016. PMID: 26775915
-
Design of biphasic polymeric 3-dimensional fiber deposited scaffolds for cartilage tissue engineering applications.Tissue Eng. 2007 Feb;13(2):361-71. doi: 10.1089/ten.2006.0127. Tissue Eng. 2007. PMID: 17504063
-
Design and fabrication of porous biodegradable scaffolds: a strategy for tissue engineering.J Biomater Sci Polym Ed. 2017 Nov;28(16):1797-1825. doi: 10.1080/09205063.2017.1354674. Epub 2017 Jul 24. J Biomater Sci Polym Ed. 2017. PMID: 28707508 Review.
-
Translating complexity and heterogeneity of pancreatic tumor: 3D in vitro to in vivo models.Adv Drug Deliv Rev. 2021 Jul;174:265-293. doi: 10.1016/j.addr.2021.04.018. Epub 2021 Apr 23. Adv Drug Deliv Rev. 2021. PMID: 33895214 Review.
Cited by
-
Chemoradiotherapy screening in a novel biomimetic polymer based pancreatic cancer model.RSC Adv. 2019 Dec 17;9(71):41649-41663. doi: 10.1039/c9ra09123h. eCollection 2019 Dec 13. RSC Adv. 2019. PMID: 35541584 Free PMC article.
-
Detailing the ultrastructure's increase of prion protein in pancreatic adenocarcinoma.World J Gastroenterol. 2021 Nov 14;27(42):7324-7339. doi: 10.3748/wjg.v27.i42.7324. World J Gastroenterol. 2021. PMID: 34876792 Free PMC article.
-
Engineering of biomaterials for tumor modeling.Mater Today Adv. 2020 Dec;8:100117. doi: 10.1016/j.mtadv.2020.100117. Epub 2020 Nov 12. Mater Today Adv. 2020. PMID: 34541484 Free PMC article.
-
Development of bioluminescent chick chorioallantoic membrane (CAM) models for primary pancreatic cancer cells: a platform for drug testing.Sci Rep. 2017 Mar 17;7:44686. doi: 10.1038/srep44686. Sci Rep. 2017. PMID: 28304379 Free PMC article.
-
Modeling pancreatic cancer with organoids.Trends Cancer. 2016 Apr;2(4):176-190. doi: 10.1016/j.trecan.2016.03.004. Trends Cancer. 2016. PMID: 27135056 Free PMC article.
References
-
- Siegel R, Naishadham D, Jemal A. Cancer statistics, 2012. CA Cancer J Clin 2012; 62:10-29; PMID:22237781; http://dx.doi.org/10.3322/caac.20138 - DOI - PubMed
-
- Vincent A, Herman J, Schulick R, Hruban RH, Goggins M. Pancreatic cancer. Lancet 2011; 378:607-20; PMID:21620466; http://dx.doi.org/10.1016/S0140-6736(10)62307-0 - DOI - PMC - PubMed
-
- Esposito I, Konukiewitz B, Schlitter AM, Klöppel G. New insights into the origin of pancreatic cancer: role of atypical flat lesions in pancreatic carcinogenesis. Pathologe 2012; 33:189-93; PMID:23011021; http://dx.doi.org/10.1007/s00292-012-1673-x - DOI - PubMed
-
- Maitra A, Hruban RH. Pancreatic cancer. Annu Rev Pathol 2008; 3:157-88; PMID:18039136; http://dx.doi.org/10.1146/annurev.pathmechdis.3.121806.154305 - DOI - PMC - PubMed
-
- Herreros-Villanueva M, Gironella M, Castells A, Bujanda L. Molecular markers in pancreatic cancer diagnosis. Clin Chim Acta 2013;418:22-9; PMID:23305796; http://dx.doi.org/10.1016/j.cca.2012.12.025 - DOI - PubMed
Publication types
MeSH terms
Substances
LinkOut - more resources
Full Text Sources
Other Literature Sources
Medical
Miscellaneous
