

Dysregulated Class I histone deacetylases are indicators of poor prognosis in multiple myeloma
- PMID: 25482492
- PMCID: PMC4622977
- DOI: 10.4161/15592294.2014.983367
Dysregulated Class I histone deacetylases are indicators of poor prognosis in multiple myeloma
Abstract
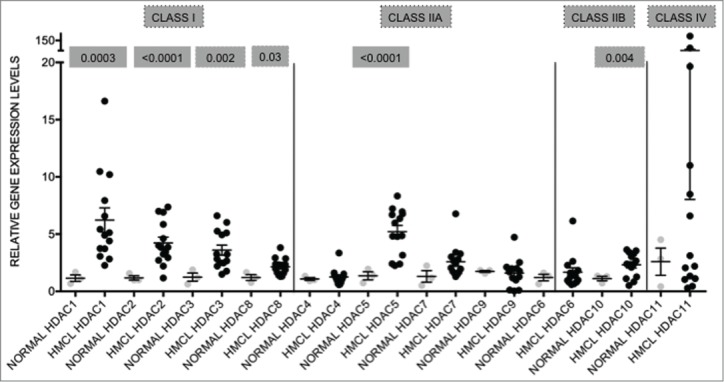
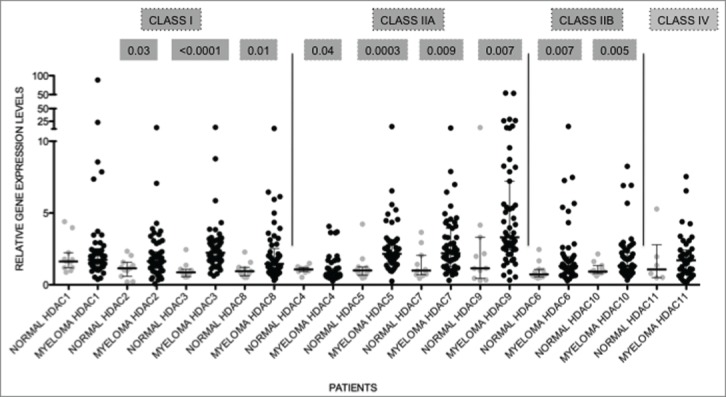
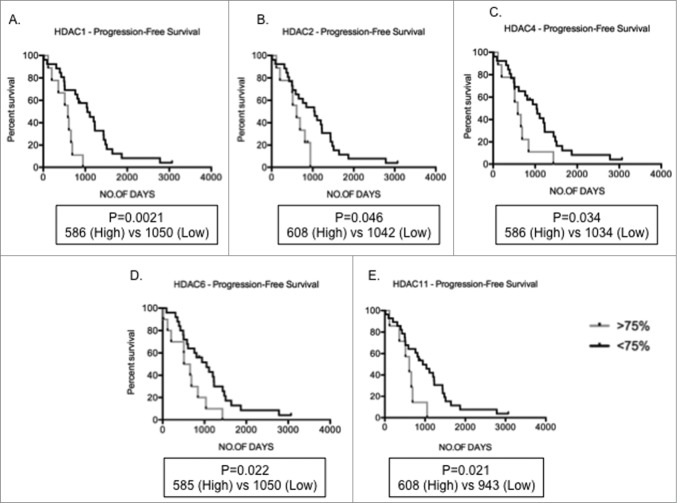
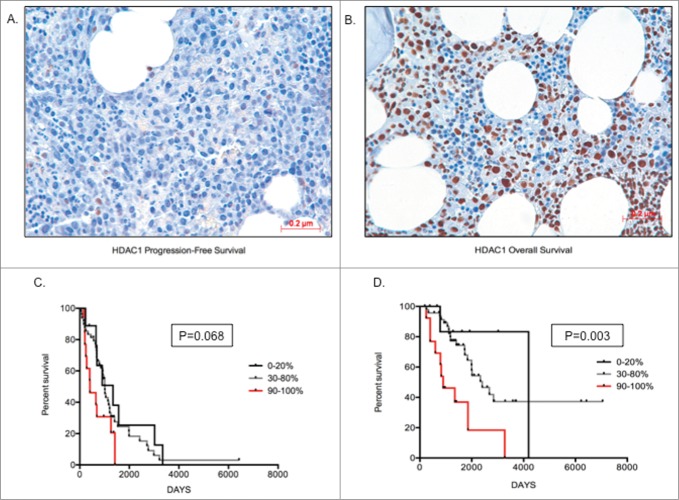
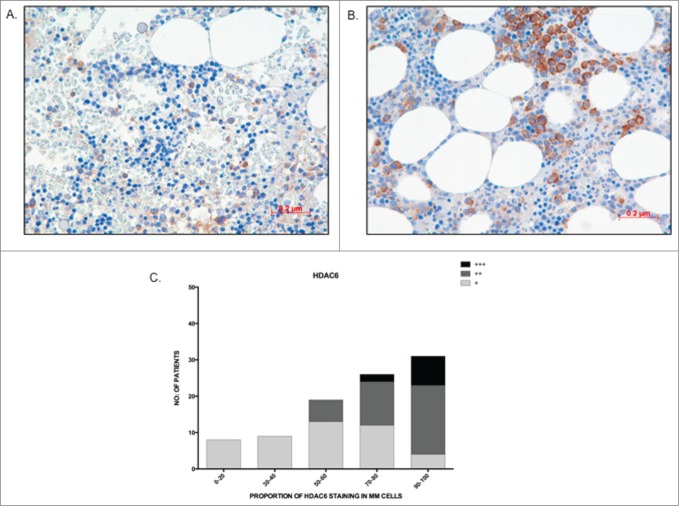
Histone deacetylases (HDAC) control gene expression through their ability to acetylate proteins, thereby influencing a diverse range of cellular functions. Class I HDAC (HDAC1-3 and 8) and HDAC6 are predominantly upregulated in malignancies and their altered expression in some cancers has a significant prognostic implication. The expression and prognostic consequence of dysregulated Class I HDAC and HDAC6, key players in multiple myeloma (MM), are unknown. This study hypothesized that HDAC are dysregulated in MM and patients with high expression have significantly poorer prognostic outcomes. Quantitative PCR for 11 HDAC (Class I, II, and IV) was performed in genetically heterogeneous human myeloma cell lines (HMCL) and primary MM and compared to normal plasma cells (PC). In HMCL, HDAC1-3 and 8 (Class I), and HDAC5 and HDAC10 (Class II) were significantly upregulated compared to normal PC. In primary MM, the median expression level of all of the HDAC, except HDAC1 and HDAC11, were elevated when compared to normal PC. Patients with higher levels of HDAC1-3, HDAC4, HDAC6, and HDAC11 transcripts demonstrated a significantly shorter progression-free survival (PFS). Immunohistochemical staining for HDAC1 and HDAC6 on bone marrow trephines from a uniformly treated cohort of transplant eligible MM patients revealed that HDAC1 protein was detectable in most patients and that higher levels of MM cell HDAC1 protein expression (≥90 % versus ≤20 % MM cell positivity) correlated with both shorter PFS (P = 0 .07) and shorter overall survival (P = 0 .003). Conversely, while the majority of patients expressed HDAC6, there was no correlation between HDAC6 levels and patient outcome. Together, these results indicate that overexpression of Class I HDAC, particularly HDAC1, is associated with poor prognosis in MM.
Keywords: Class I HDAC; HDAC expression; hematological malignancy; histone deacetylases; multiple myeloma; prognosis; .
Figures
References
-
- Greipp PR, San Miguel J, Durie BG, Crowley JJ, Barlogie B, Blade J, Boccadoro M, Child JA, Avet-Loiseau H, Kyle RA, et al. International staging system for multiple myeloma. J Clin Oncol 2005; 23:3412-20; PMID:15809451; http://dx.doi.org/ 10.1200/JCO.2005.04.242 - DOI - PubMed
-
- Chapman MA, Lawrence MS, Keats JJ, Cibulskis K, Sougnez C, Schinzel AC, Harview CL, Brunet JP, Ahmann GJ, Adli M, et al. Initial genome sequencing and analysis of multiple myeloma. Nature 2011; 471:467-72; PMID:21430775; http://dx.doi.org/ 10.1038/nature09837 - DOI - PMC - PubMed
-
- Morgan GJ, Walker BA, Davies FE. The genetic architecture of multiple myeloma. Nat Rev Cancer 2012; 12:335-48; PMID:22495321; http://dx.doi.org/ 10.1038/nrc3257 - DOI - PubMed
-
- Kuehl WM, Bergsagel PL. Early genetic events provide the basis for a clinical classification of multiple myeloma. Hematol Am Soc Hematol Educ Prog 2005:346-52; PMID:16304402; http://dx.doi.org/ 10.1182/asheducation-2005.1.346 - DOI - PubMed
-
- Bergsagel PL, Kuehl WM. Molecular pathogenesis and a consequent classification of multiple myeloma. J Clin Oncol 2005; 23:6333-8; PMID:16155016; http://dx.doi.org/ 10.1200/JCO.2005.05.021 - DOI - PubMed
MeSH terms
Substances
LinkOut - more resources
Full Text Sources
Other Literature Sources
Medical
Miscellaneous