. 2014 Dec 11;9(5):1841-1855.
doi: 10.1016/j.celrep.2014.11.004. Epub 2014 Dec 4.

DNA hydroxymethylation profiling reveals that WT1 mutations result in loss of TET2 function in acute myeloid leukemia

Affiliations

DNA hydroxymethylation profiling reveals that WT1 mutations result in loss of TET2 function in acute myeloid leukemia

Raajit Rampal et al. Cell Rep. .

Abstract

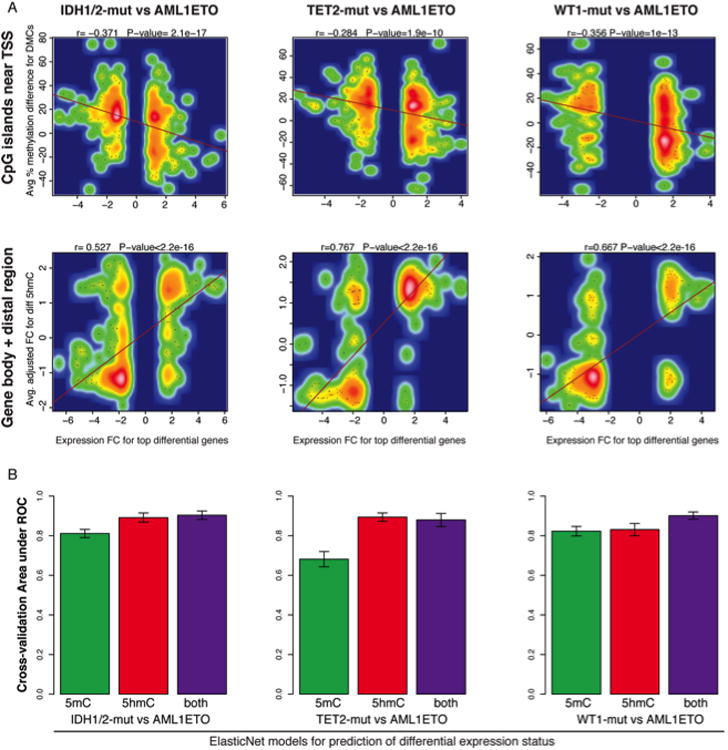
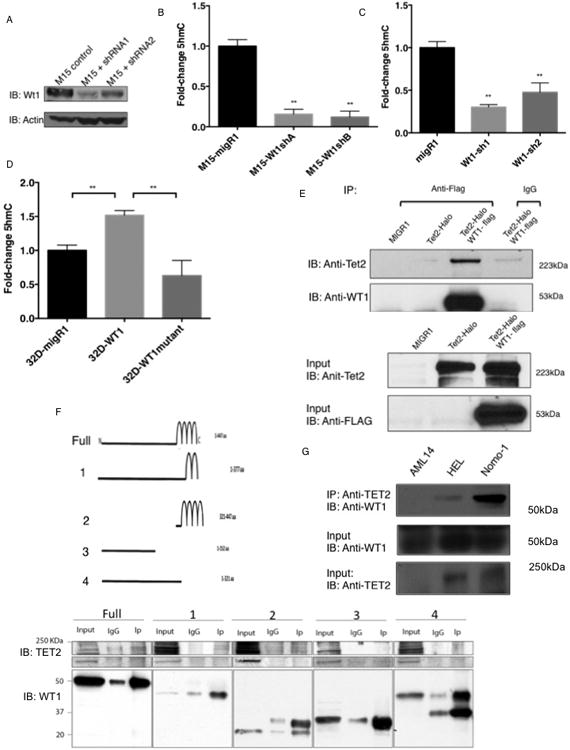
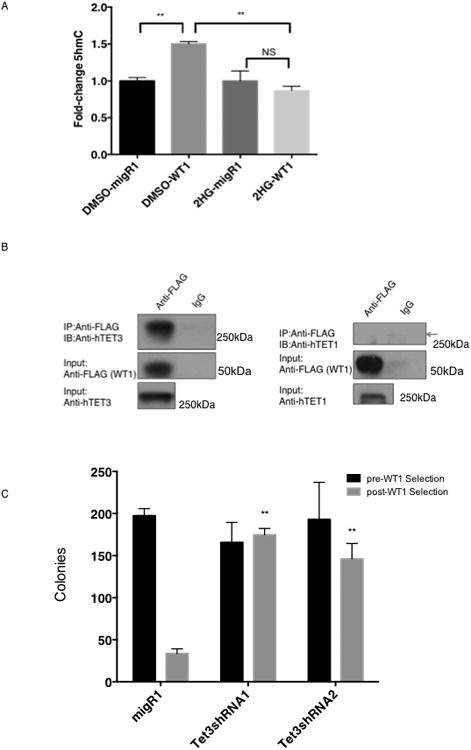
Somatic mutations in IDH1/IDH2 and TET2 result in impaired TET2-mediated conversion of 5-methylcytosine (5mC) to 5-hydroxymethylcytosine (5hmC). The observation that WT1 inactivating mutations anticorrelate with TET2/IDH1/IDH2 mutations in acute myeloid leukemia (AML) led us to hypothesize that WT1 mutations may impact TET2 function. WT1 mutant AML patients have reduced 5hmC levels similar to TET2/IDH1/IDH2 mutant AML. These mutations are characterized by convergent, site-specific alterations in DNA hydroxymethylation, which drive differential gene expression more than alterations in DNA promoter methylation. WT1 overexpression increases global levels of 5hmC, and WT1 silencing reduced 5hmC levels. WT1 physically interacts with TET2 and TET3, and WT1 loss of function results in a similar hematopoietic differentiation phenotype as observed with TET2 deficiency. These data provide a role for WT1 in regulating DNA hydroxymethylation and suggest that TET2 IDH1/IDH2 and WT1 mutations define an AML subtype defined by dysregulated DNA hydroxymethylation.


Figures

Figure 1
Figure 1
WT1 mutations are inversely correlated with TET2/IDH1/2 mutations and display similar global methylation profile (A) Circos representation of targeted mutational data from 398 AML patients. Co-occurrence of mutations is represented by lines connecting genes. The width of connecting lines represents frequency of mutations. TET2 and IDH mutations are combined in this analysis. IDH mutations are designated by orange ribbons, TET2 mutations by yellow ribbons, and WT1 mutations by blue ribbons. (B) Promoter methylation signatures in WT1 mutant AML versus normal bone marrow (NBM) (C) Comparison of promoter methylation signatures in WT1 mutant AML and AML1-ETO AML. (D) Overlap of hypermethylated loci in WT1 mutant AML compared with those previously identified in TET2 and IDH1/2 mutant AMLs (E) 5-methylcytosine (5-mC, left panel) and 5-hydroxymethylcytosine (5-hmC, right panel) levels in AML samples from patients with or without WT1, TET2, or IDH1/2 mutations. 5-mC and 5-hmC levels were determined by liquid chromatography-electron spray ionization-tandem mass spectrometry (LC-ESI-MS/MS). Error bars represent SEM.
Figure 2
Figure 2
Convergent, site-specific alterations in DNA hydroxymethylation in AML patients with TET2, IDH1/2, and WT1 mutations. (A) KIRREL locus demonstrating depletion of 5-hmC marks in AML patients with TET2, WT1, and IDH1/2 mutations. (B) Percentages of differential 5-hmC regions and 5-mC bases. Bar plot on the left demonstrates percentages of hypo- or hyper-5-hmC regions out of all canonical peaks in WT1, TET2, and IDH1/2 mutants compared to AML1-ETO patients. Bar plot on the right demonstrates the percentages of hypo- and hyper-methylated CpGs out of all covered CpGs in WT1, TET2, and IDH1/2 mutants compared to AML1-ETO patients. Differentially methylated CpGs that overlap with differential 5-hmC regions are removed from the analysis. (C) Genomic locations of differentially hydroxymethylated regions and DMCs. The first row shows percentages of differentially hydroxymethylated regions overlapping with gene annotation, CpG island annotation and enhancer annotation. The second row shows the percentage of DMCs overlapping with the aforementioned annotation categories. (D) Distances to nearest TSS for differentially DHMRs and DMCs for IDH1/2, TET2, and WT1 mutants. All comparisons are against AML1-ETO patients.
Figure 3
Figure 3
Correlation of gene expression with DNA methylation and hydroxymethylation. (A) Scatterplots and correlations of differential gene expression and average methylation difference on CpG islands near TSS for IDH-mut vs. AML1-ETO, TET2-mut vs. AML1-ETO and WT1-mut vs. AML1-ETO (top row). Scatterplots and correlations of differential gene expression and average adjusted fold changes of 5-hmC canonical peaks for IDH-mut vs. AML1-ETO, TET2-mut vs. AML1-ETO and WT1-mut vs. AML1-ETO (bottom row). (B) Mean AUC (area under receiver operator curve) for gene expression classification models based on differential 5-mC and 5-hmC attributes for IDH-mut vs. AML1-ETO, TET2-mut vs. AML1-ETO and WT1-mut vs. AML1-ETO. Classification models are based on differential 5-hmC attributes and/or differential 5-mC attributes aiming to predict up-regulated and down-regulated genes. Error bars represent SD of AUC of the cross-validation models.
Figure 4
Figure 4
Site-specific 5-hydroxymethylcytosine alterations in WT1 and TET2 mutant AML comprise a subset of the alterations in IDH1/2 mutant AML. (A) Bar plots showing number of hypo-DHMRs per subtype compared to AML1-ETO. For each subtype, the number of hypo-DHMRs that do not overlap with hypo-DHMRs of IDH-mut are color-coded. (B) Venn diagram showing the number hypo-DHMRs for each subtype and their overlap. (C) Bar plots showing number of hyper-DMCs per subtype compared to AML1-ETO. For each subtype, the number of hyper-DMCs that do not overlap with hyper- DMCs of IDH-mut are color-coded. (D) Venn diagram showing the number hyper-DMCs for each subtype and their overlap.
Figure 5
Figure 5
WT1 complexes with TET2 and alterations in Wt1 levels result in changes in 5-hydroxymethylcytosine levels. (A) Western Blot analysis of Wt1 silencing in mouse mesonephron cells (M15 cells) using vector or shRNA targeting Wt1 (all constructs contained a puromycin resistance marker). Analysis was carried out after puromycin selection. (B) 5-hmC levels were measured by LC-MS from samples of Mouse mesonephron cells (M15) transfected with vector or Wt1-targeted shRNA, (both with a puromycin resistance marker) following puromycin selection and confirmation of knockdown (C) 5-hmC levels were measured by LC-MS from samples of murine whole bone marrow transduced with either vector or Wt1-targeted shRNA (D) 5-hmC levels were measured by LC-MS from samples of 32D cells transduced with WT1 isoform D or a WT1 truncation mutant. (“**” P<0.01, T-test). No statistically significant difference was observed between 32D cells transduced with migR1 and 32D cells transduced with WT1-mutant. Error bars represent SEM. (E) IP was carried out with anti-FLAG antibody on lysate from GP2/293T overexpressing vector, TET2-Halo, or both WT1-FLAG isoform D and TET2-Halo. IP was also carried using an equal amount of Rat IgG on lysate from GP2/293T cells overexpressing both WT1-FLAG and TET2-Halo. (F) IP performed on lysate from GP2/293T cells overexpressing both full length or truncated forms of WT1-HA and TET2-Halo. Control IP performed with Rat IgG. (G) IP performed on lysate of Human leukemia cell lines using an anti-TET2 antibody. (IP: Immunoprecipitation IB: Immunoblot)
Figure 6
Figure 6
Wt1 silencing phenocopies Tet2 silencing. (A) Murine bone marrow was transduced with a vector or with shRNA (all constructs containing IRES-GFP) targeting Tet2 or Wt1. GFP-positive cells were selected by flow cytometry. GFP-positive cells were maintained in liquid culture and analyzed by flow for c-KIT expression. (B) GFP-positive cells were plated in methylcellulose and assessed for colony morphology. (C) Whole Bone marrow extracted from a Tet2 knockout mouse was transduced with vector, WT1 isoform D, or a WT1 truncation mutant GFP-positive cells were selected by flow cytometry. Cells were plated in methylcellulose and colony formation was assessed (** p<0.01 T-test) (D) Cells derived from first methylcellouse plating were analyzed for 5-hmC levels by LC-MS (** p<0.05 T-test) (E) GFP-positive cells from initial transduction were also maintained in liquid culture for three days and analyzed for c-KIT expression (F) Whole bone marrow from Tet2KO mice was transduced with vector, WT1 isoform D, or WT1 mutant. Cells were then injected into lethally irradiated wildtype recipient mice. GFP percentage was assessed from peripheral blood of mice at time points indicated. Error bars represent SEM.
Figure 7
Figure 7
WT1 binds to TET3 (A) GP2/293T cells were transfected with vector or WT1 isoform D. Cells were grown in the presence of DMSO or 2HG. 5-hmC levels were subsequently analyzed by LC-MS. (B) GP2/293T cells were transfected with a WT1-FLAG construct along with TET3 or TET1 construct. IP was carried out with either an anti-FLAG antibody or an equivalent amount of Rat IgG. (C) Tet2-deficient BM cells were transduced with empty vector or two different shRNAs targeting Tet3 (all with IRES GFP). GFP positive cells were sorted for, and then transduced with a WT1 construct (with puromycin resistance marker), followed by puromycin selection. Cells were plated in methycellulose, and colonies were counted. Comparison of post-WT1 selection samples demonstrated statistically significant increase in colonies in cells transduced with Tet3 shRNA (** p<0.01). Error bars represent SEM.

Similar articles

Cited by

References

    1. Abbas S, Erpelinck-Verschueren CAJ, Goudswaard CS, Lowenberg B, Valk PJM. Mutant Wilms' tumor 1 (WT1) mRNA with premature termination codons in acute myeloid leukemia (AML) is sensitive to nonsense-mediated RNA decay (NMD) Leukemia. 2010;24:660–663. - PubMed
    1. Bell JT, Pai AA, Pickrell JK, Gaffney DJ, Pique-Regi R, Degner JF, Gilad Y, Pritchard JK. DNA methylation patterns associate with genetic and gene expression variation in HapMap cell lines. Genome biology. 2011;12:R10. - PMC - PubMed
    1. Bernt KM, Zhu N, Sinha AU, Vempati S, Faber J, Krivtsov AV, Feng Z, Punt N, Daigle A, Bullinger L, et al. MLL-rearranged leukemia is dependent on aberrant H3K79 methylation by DOT1L. Cancer Cell. 2011;20:66–78. - PMC - PubMed
    1. Bullinger L, Ehrich M, Dohner K, Schlenk RF, Dohner H, Nelson MR, van den Boom D. Quantitative DNA methylation predicts survival in adult acute myeloid leukemia. Blood. 2010;115:636–642. - PubMed
    1. Daigle SR, Olhava EJ, Therkelsen CA, Majer CR, Sneeringer CJ, Song J, Johnston LD, Scott MP, Smith JJ, Xiao Y, et al. Selective killing of mixed lineage leukemia cells by a potent small-molecule DOT1L inhibitor. Cancer Cell. 2011;20:53–65. - PMC - PubMed

Publication types

MeSH terms