. 2014 Dec 11;9(5):1798-1811.
doi: 10.1016/j.celrep.2014.11.016. Epub 2014 Dec 4.

Loss of abhd5 promotes colorectal tumor development and progression by inducing aerobic glycolysis and epithelial-mesenchymal transition

Affiliations

Loss of abhd5 promotes colorectal tumor development and progression by inducing aerobic glycolysis and epithelial-mesenchymal transition

Juanjuan Ou et al. Cell Rep. .

Erratum in

Abstract

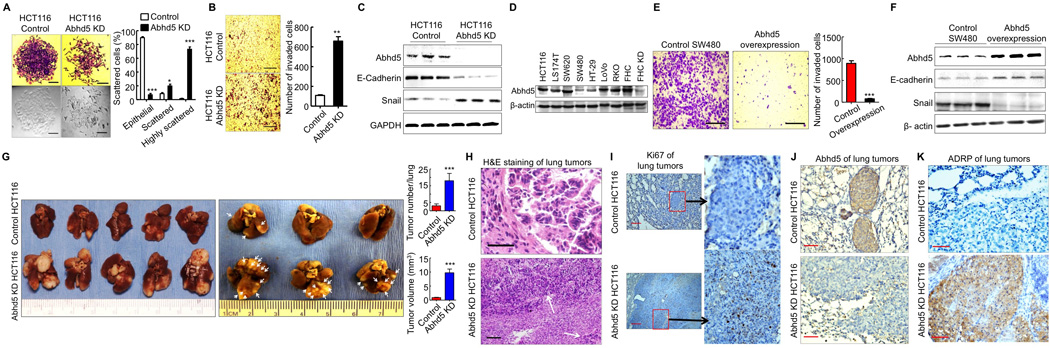
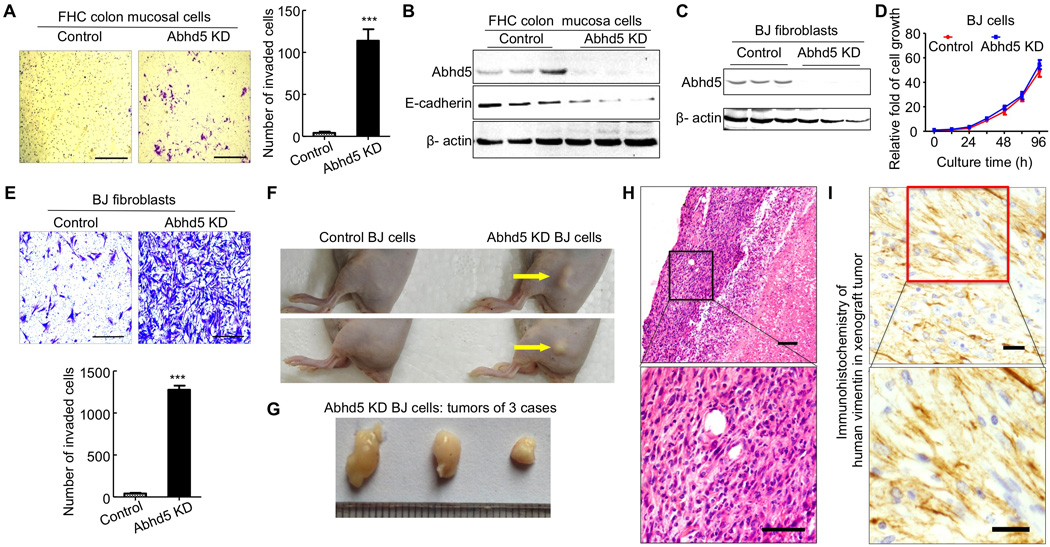
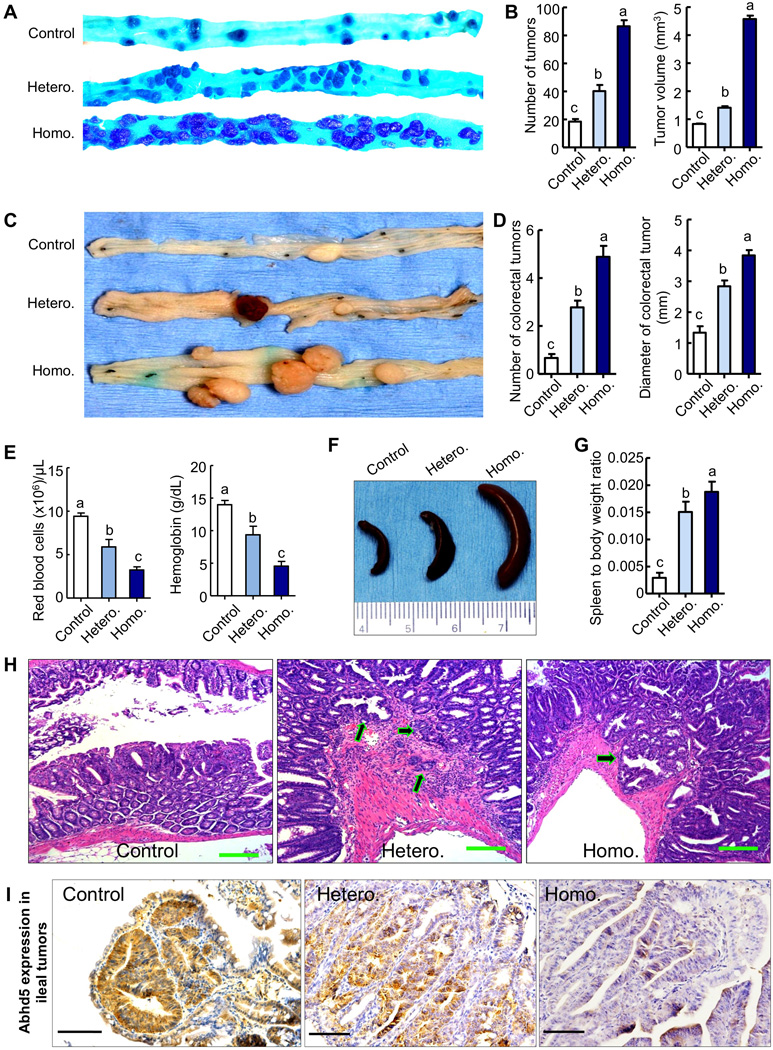
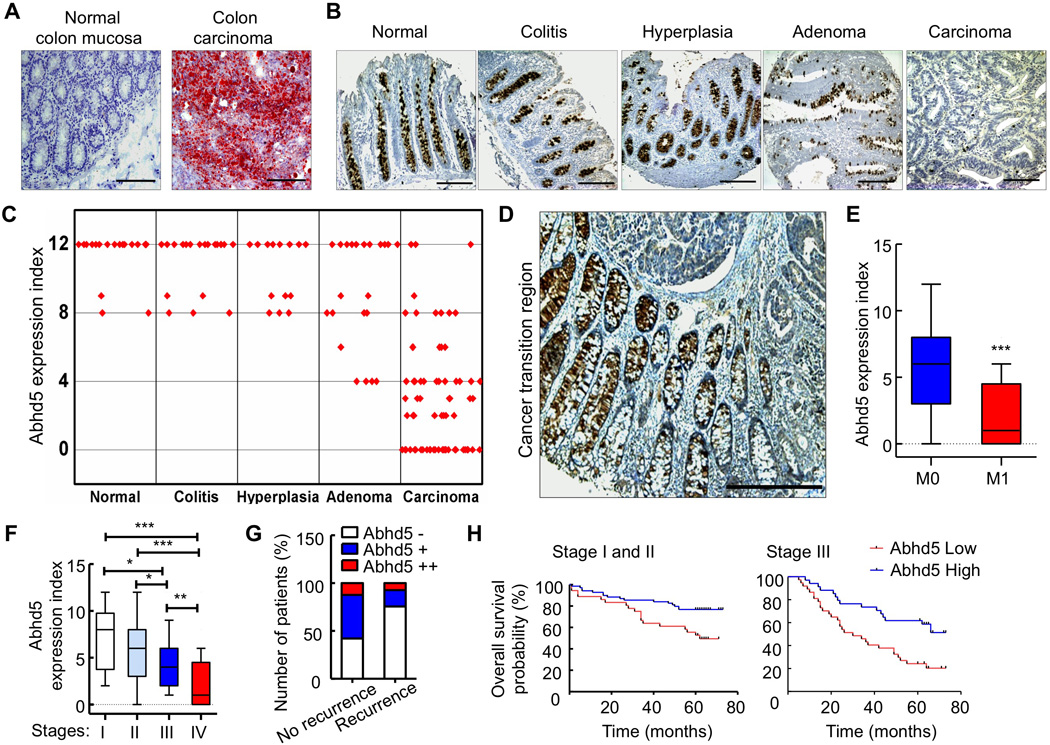
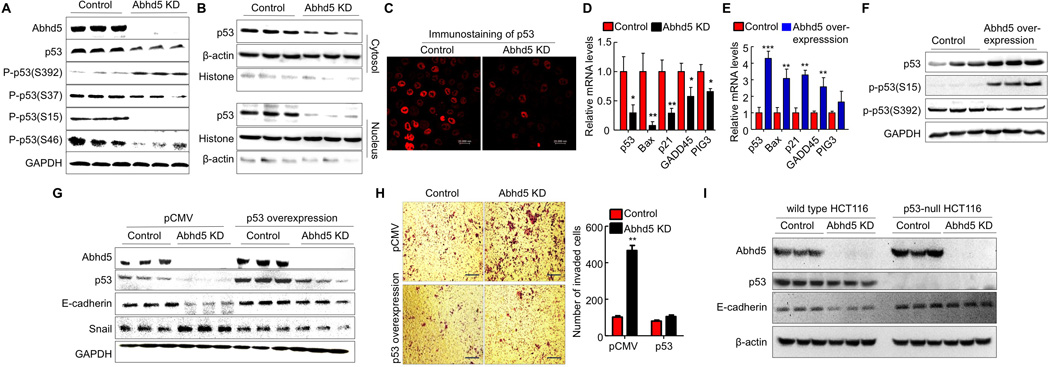
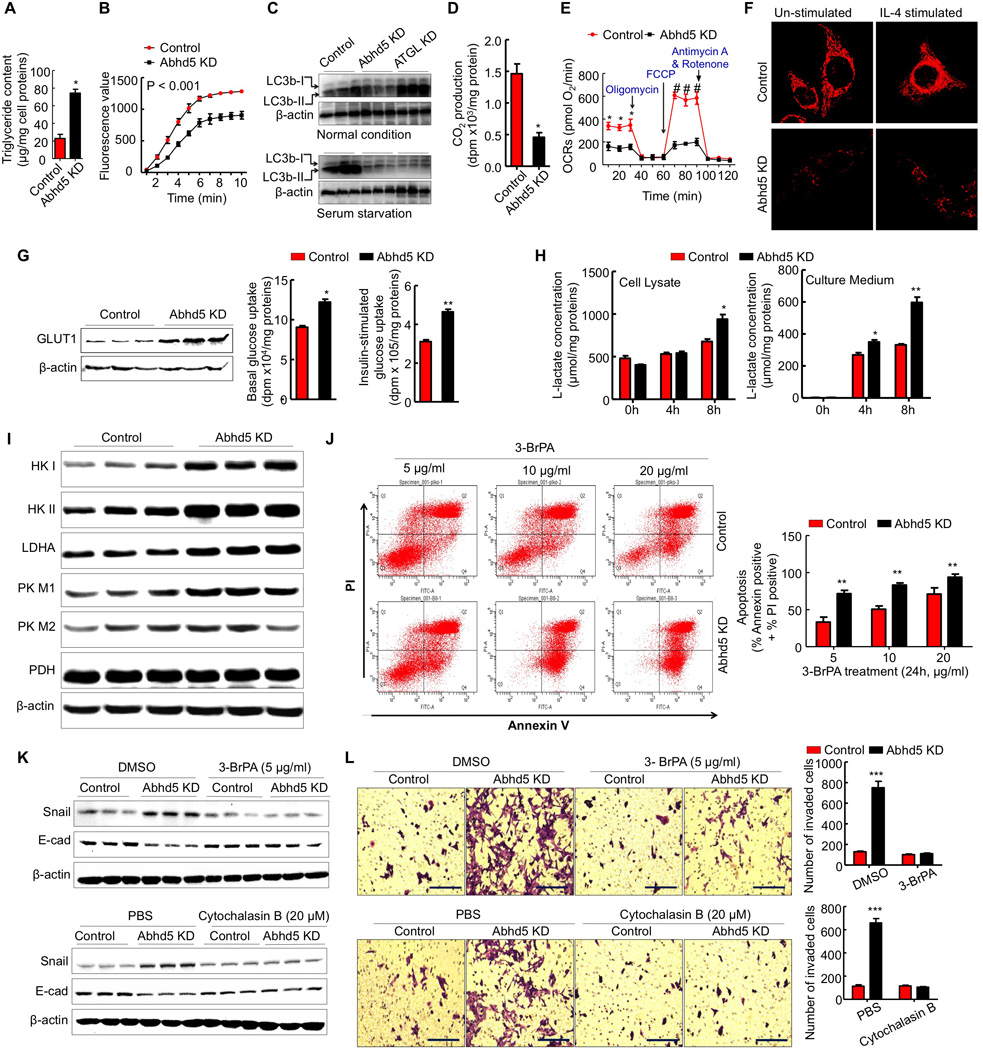
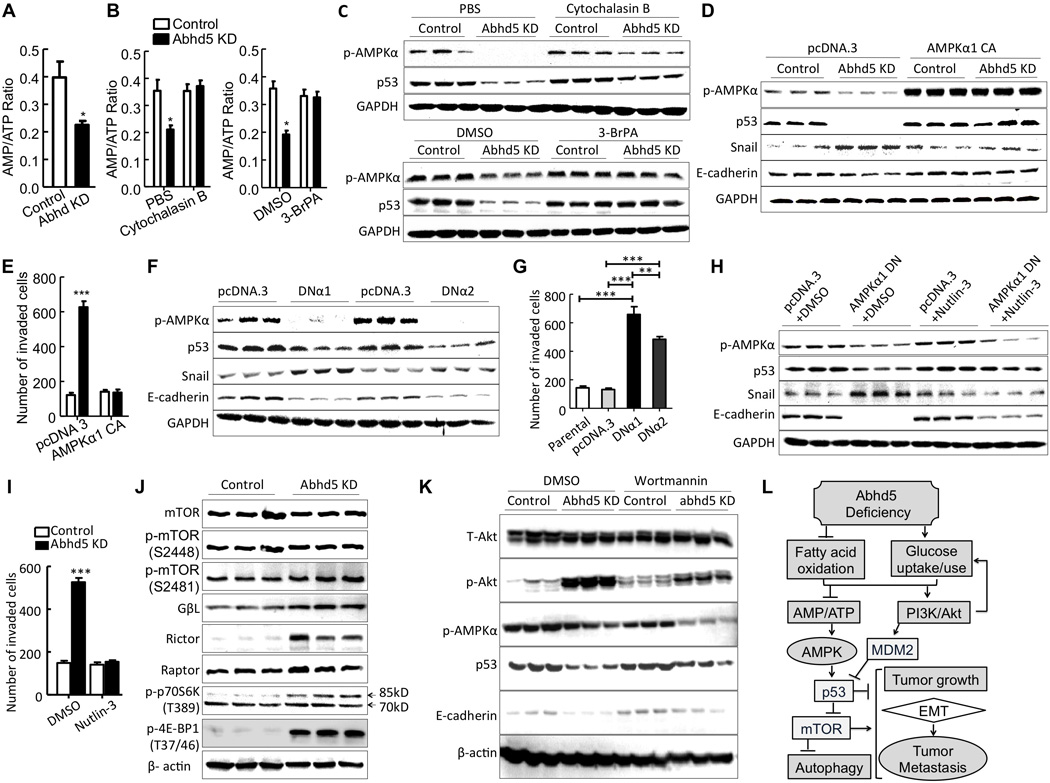
How cancer cells shift metabolism to aerobic glycolysis is largely unknown. Here, we show that deficiency of α/β-hydrolase domain-containing 5 (Abhd5), an intracellular lipolytic activator that is also known as comparative gene identification 58 (CGI-58), promotes this metabolic shift and enhances malignancies of colorectal carcinomas (CRCs). Silencing of Abhd5 in normal fibroblasts induces malignant transformation. Intestine-specific knockout of Abhd5 in Apc(Min/+) mice robustly increases tumorigenesis and malignant transformation of adenomatous polyps. In colon cancer cells, Abhd5 deficiency induces epithelial-mesenchymal transition by suppressing the AMPKα-p53 pathway, which is attributable to increased aerobic glycolysis. In human CRCs, Abhd5 expression falls substantially and correlates negatively with malignant features. Our findings link Abhd5 to CRC pathogenesis and suggest that cancer cells develop aerobic glycolysis by suppressing Abhd5-mediated intracellular lipolysis.


Figures

Figure 1
Figure 1. Abhd5 Suppresses EMT and Growth Advantage of CRC Cells
(A) Morphology (crystal violet staining and phase-contrast) of HCT116 control and Abhd5-knockdown (KD) cells. One hundred cells in each colony were counted under microscopy (200x). Ten colonies were counted for each group. Epithelial: cells attached to each other tightly; Scattered: cells scattered, but still attached to others; Highly scattered: the scattered cells that had no contact with others. *P < 0.01. ***P < 0.0001. Scale bar = 50 µm. (B) Transwell assays. Scale bar = 200 µm. (C) Western blots of EMT markers. (D) Western blots of Abhd5 in colon cancer and normal colon epithelial cell lines. (E) Transwell assays of SW480 cells overexpressing Abhd5. Scale bar = 200 µm. (F) Western blots of EMT markers in SW480 cells overexpressing Abhd5. (G) Lung tumor lesions induced by the tail vein injection of HCT116 cells in nude mice (left panel, nonfixed organ; right panel, formalin-fixed organ). (H) H&E staining of the above lung tumors. Scale bar = 100 µm. (I–K) Immunohistochemistry of Ki67, Abhd5 and ADRP in the above lung tumors. Scale bar = 100 µm.
Figure 2
Figure 2. Abhd5 Knockdown Induces Malignant Transformation of Normal Colon Mucosal Cells and Foreskin Fibroblasts
(A) Transwell assays of Abhd5-KD and control FHC cells (Passage: ~14). Scale bar = 200 µm. (B) Western blots. (C) Abhd5 knockdown. (D) Growth curve of normal and Abhd5-KD BJ cells. (E) Transwell assays. Scale bar = 200 µm. (F) Gross appearance of subcutaneous xenografts in Balb/c nude mice 8 weeks after injection of control or Abhd5-KD BJ cells (5×10⁴ cells per mouse). (G) Subcutaneous xenografts dissected from the mice described in (F). (H) H&E staining of the above subcutaneous xenografts. Scale bar = 100 µm. (I) Immunohistochemistry of human vimentin in the above xenografts. Scale bar = 50 µm.
Figure 3
Figure 3. Intestine-Specific Knockout of Abhd5 Promotes Tumorigenesis and Aggressiveness of Tumors in ApcMin/+ Mice
(A) Macroscopic appearance of tumors in the distal ilia of 100-day-old male mice. Control, ApcMin/+/Abhd5+/+/Cre+; Hetero, ApcMin/+/Abhd5f/+/Cre+; Homo, ApcMin/+/Abhd5f/f/Cre+. (B) Statistical analysis of tumor number and size in the entire small intestine. (C, D) Macroscopic appearance (C) of tumors and statistical analysis of tumor number and size (D) in the colorectum of 100-day-old mice. (E) Red blood cell counts in 100-day-old mice. (F, G) Macroscopic appearance (E) of spleens and statistical analysis (F) of spleen-to-body weight ratios in 100-day-old mice. (H) Representative H&E sections of tumors in the small intestine of control, heterozygous (Hetero.) and homozygous (Homo.) intestine-specific Abhd5 knockout male mice at 100 days of age. Arrows point to invasive glands. Scale bar = 100 µm. (I) Immunohistochemistry of Abhd5 in the tumors described in (H). Different letters associated with individual bars represent significant statistical differences among the groups (One-way ANOVA; P < 0.0001; n = 9 in all experiments). Scale bar = 100.
Figure 4
Figure 4. Loss of Abhd5 Expression Correlates Positively with CRC Development and Progression in Humans
(A) Oil-red O staining of the normal colon mucosa and the colon carcinoma from the same patient. Ten patients examined and similar results obtained. Scale bar = 200 µm. (B, C) Representative immunostaining images (B, Scale bar = 200 µm) and statistical analysis (One-way ANOVA) of expression index (C) of Abhd5 in colon tissues of different diseases. P < 0.001 between carcinoma and each of other disease stages. (D) A representative immunostaining image of Abhd5 in a human colon carcinoma and its adjacent normal tissue, showing gradual loss of Abhd5 expression. Scale bar = 200 µm. (E, F) Statistical analysis of Abhd5 expression levels between M0 CRCs (n = 218) and M1 CRCs (n = 34) (E) (Student t-test), and among CRCs of different stages (F) (Oneway ANOVA). I, n = 18; II, n = 117; III, n = 83; IV, n = 34. *P < 0.01. **P < 0.001. ***P < 0.0001. (G) Fisher’s Exact Test of the correlation between Abhd5 expression levels and the risk of recurrence in Stage I and II CRC patients (n = 57 in No recurrence; n = 41 in Recurrence; P = 0.004). (H) Statistical analysis of the correlation between Abhd5 expression levels and the Overall Survival of CRC patients (Stages I, & II, n = 105; Stage III, n = 71). P < 0.01 (Kaplan-Meier Survival Curves).
Figure 5
Figure 5. Abhd5 Deficiency Induces EMT via inactivating p53
(A) Western blots of total p53 and phosphorylated (P-) p53 levels in HCT116 cells. (B) Western blots of p53 protein in the cytosol and nucleus of HCT116 cells. (C) Immunofluorescence staining of p53 in HCT116 cells. (D) The mRNA levels of p53 target genes in HCT116 cells. (E) The mRNA levels of p53 target genes in HCT116 cells overexpressing human Abhd5. (F) Western blots of p53 protein in HCT116 cells overexpressing human Abhd5. (G) Normalization of E-cadherin and Snail expression by forced expression of p53 in Abhd5-KD HCT116 cells. (H) Attenuation of increased cell migration by forced expression of p53 in Abhd5-KD HCT116 cells. Scale bar = 200 µm. (I) Western blots of Abhd5, p53, E-cadherin, and β-actin in p53-null and parental wild-type control HCT116 cells.
Figure 6
Figure 6. Abhd5 Deficiency-Induced EMT in CRC Cells Depends on Glucose Uptake and Aerobic Glycolysis
(A) Triglyceride content of control and Abhd5-KD HCT116 cells. (B) Triglyceride hydrolase activity of HCT116 cell lysates. (C) Western blots of LC3b protein in HCT116 cells. (D) CO2 produced from [14C]palmitic acid in HCT116 cells (n = 4). *P < 0.01. (E) Seahorse Assays of mitochondrial oxygen consumption rates (OCRs) in HCT116 cells (n = 3). *P < 0.01. (F) Mitochondria stained with Mitotracker-Red FM in HCT116 cells. Scale bar = 10 µm. (G) GLUT1 protein expression as well as basal and insulin-stimulated uptake of [3H]2-deoxy-D-glucose in HCT116 cells (n = 3). *P < 0.05. **P < 0.01. (H) Lactate concentrations in the lysate and culture medium of HCT116 cells (n = 3). *P < 0.05. **P < 0.01. (I) Western blots of glycolytic proteins in HCT116 cells. (J) Flow cytometry analysis of apoptosis of HCT116 cells treated with a glycolysis inhibitor 3-bromopyruvate (BrPA). (K) Western blots of EMT markers in Abhd5-KD HCT116 cells treated with a glycolysis inhibitor 3-BrPA (5 µg/ml, 24h) or a glucose transport inhibitor cytochalasin B (20 µM, 24h). (L) Transwell assays of Abhd5-KD HCT116 cells treated with 3-BrPA (5 µg/ml, 48h) or cytochalasin B (20 µM, 48h). Scale bar = 100 µm.
Figure 7
Figure 7. Aerobic Glycolysis Induces p53 Suppression via Inactivating AMPK in Abhd5-deficient Cells
(A) The AMP/ATP ratio in HCT116 cells. (B) The AMP/ATP ratio in HCT116 cells treated with cytochalasin B (20 µM, 12h) or 3-BrPA (5 µg/ml, 12h). (C) Western blots of p53 and phosphorylated (p)-AMPKα proteins in HCT116 cells treated with cytochalasin B (20 µM, 24h) and 3-BrPA (5 µg/ml, 24h). (D) Western blots of p53, Snail, E-cadherin and phosphorylated (p)-AMPKα proteins in HCT116 cells expressing constitutively active (CA) AMPKα1. (E) Transwell assays of HCT116 cells expressing CA-AMPKα1. (F) Western blots of HCT116 cells expressing a dominant negative (DN) AMPKα1 (DNα1) or AMPKα2 (DNα2). (G) Transwell assays of HCT116 cells expressing DNα1 or DNα2. (H) Western blots of HCT116 cells expressing CA-AMPKα1 in the presence of Nutlin-3 (10 µM, 24h). (I) Transwell assays of HCT116 cells expressing CA-AMPKα1 in the presence of Nutlin-3 (10 µM, 48h). (J) Western blots of mTOR pathway proteins in HCT116 cells. (K) Western blots of HCT116 cells treated with or without Wortmannin (100 nmol/L for 24 h). (L) Proposed mechanisms underlying Abhd5 deficiency-induced malignancy in CRCs. *P < 0.05, **P < 0.001, ***P < 0.0001.

Similar articles

Cited by

References

    1. Accioly MT, Pacheco P, Maya-Monteiro CM, Carrossini N, Robbs BK, Oliveira SS, Kaufmann C, Morgado-Diaz JA, Bozza PT, Viola JP. Lipid bodies are reservoirs of cyclooxygenase-2 and sites of prostaglandin-E2 synthesis in colon cancer cells. Cancer research. 2008;68:1732–1740. - PubMed
    1. Behrens J, Jerchow BA, Wurtele M, Grimm J, Asbrand C, Wirtz R, Kuhl M, Wedlich D, Birchmeier W. Functional interaction of an axin homolog, conductin, with beta-catenin, APC, and GSK3beta. Science. 1998;280:596–599. - PubMed
    1. Bozza PT, Viola JP. Lipid droplets in inflammation and cancer. Prostaglandins, leukotrienes, and essential fatty acids. 2010;82:243–250. - PubMed
    1. Brown JM, Betters JL, Lord C, Ma Y, Han X, Yang K, Alger HM, Melchior J, Sawyer J, Shah R, et al. CGI-58 knockdown in mice causes hepatic steatosis but prevents diet-induced obesity and glucose intolerance. Journal of lipid research. 2010;51:3306–3315. - PMC - PubMed
    1. Brown JM, Chung S, Das A, Shelness GS, Rudel LL, Yu L. CGI-58 facilitates the mobilization of cytoplasmic triglyceride for lipoprotein secretion in hepatoma cells. Journal of lipid research. 2007;48:2295–2305. - PubMed

Publication types

Substances