

Sunflower exposed to high-intensity microwave-frequency electromagnetic field: electrophysiological response requires a mechanical injury to initiate
- PMID: 25482761
- PMCID: PMC4622848
- DOI: 10.4161/15592316.2014.972787
Sunflower exposed to high-intensity microwave-frequency electromagnetic field: electrophysiological response requires a mechanical injury to initiate
Abstract
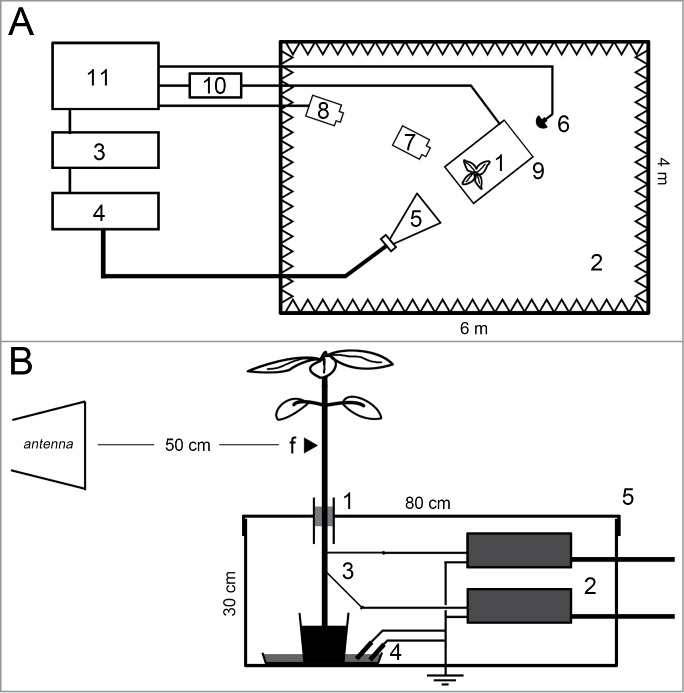
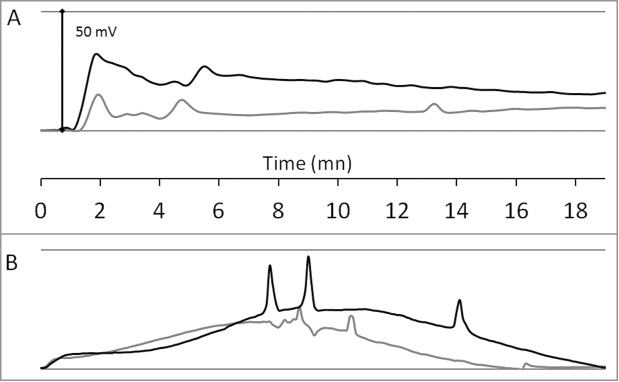
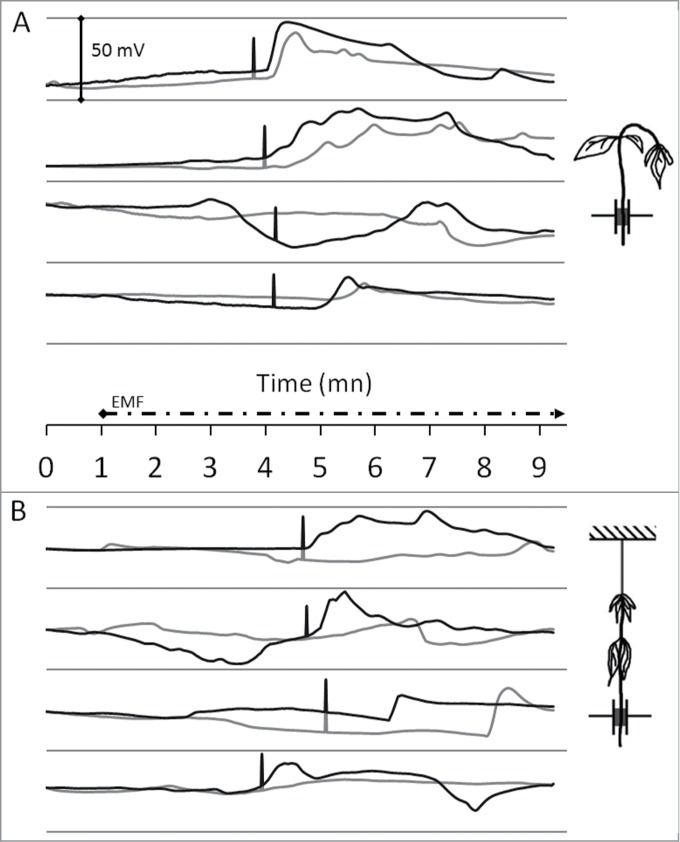
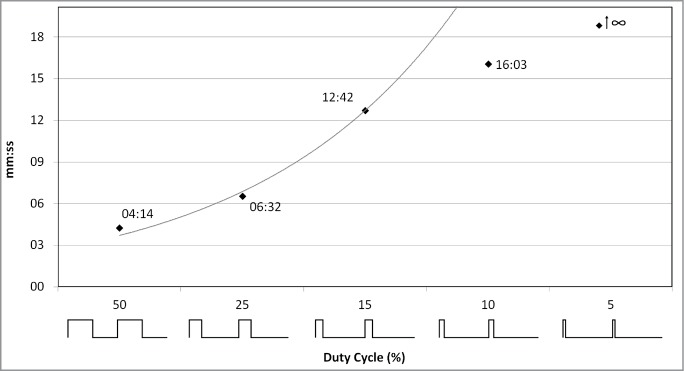
We have monitored the electrical potential variations (EPV) of sunflower plants illuminated by a high-intensity microwave-frequency (2.5 GHz, 1.5 kV/m) electromagnetic field (EMF). We have designed an appropriate set-up that allows parallel temperature and EPV measurements while part of the plant is being exposed to the field. The results show that the considered EMF does not induce plant EPV directly. This electrophysiological response appears only when the EMF leads to a mechanical injury of the tissues via a thermal effect (dielectric heating). Once the plant inner temperature reached a threshold, we systematically observed burn-like lesions associated with the bending of the stem or leaf-stalks. Theses mechanical constraints were rapidly followed by EPVs, moving through the stem.
Keywords: AP, action potential; EMF, electromagnetic field; EPV, electrical potential variation; SWP, slow wave potential; electromagnetic field; electrophysiology; heat; injury; sunflower.
Figures
Similar articles
-
Scientific evidence contradicts findings and assumptions of Canadian Safety Panel 6: microwaves act through voltage-gated calcium channel activation to induce biological impacts at non-thermal levels, supporting a paradigm shift for microwave/lower frequency electromagnetic field action.Rev Environ Health. 2015;30(2):99-116. doi: 10.1515/reveh-2015-0001. Rev Environ Health. 2015. PMID: 25879308 Review.
-
Microwave radiation alters burn injury-evoked electric potential in Nicotiana benthamiana.Plant Signal Behav. 2018;13(6):e1486145. doi: 10.1080/15592324.2018.1486145. Epub 2018 Jun 26. Plant Signal Behav. 2018. PMID: 29944441 Free PMC article.
-
Effects of microwave and radio frequency electromagnetic fields on lichens.Bioelectromagnetics. 1996;17(4):327-34. doi: 10.1002/(SICI)1521-186X(1996)17:4<327::AID-BEM9>3.0.CO;2-5. Bioelectromagnetics. 1996. PMID: 8891192
-
Remote measurement of sunflower seed moisture content by the use of microwaves.J Sci Food Agric. 2017 Nov;97(14):4880-4882. doi: 10.1002/jsfa.8359. Epub 2017 May 5. J Sci Food Agric. 2017. PMID: 28386909
-
The implications of non-linear biological oscillations on human electrophysiology for electrohypersensitivity (EHS) and multiple chemical sensitivity (MCS).Rev Environ Health. 2015;30(4):293-303. doi: 10.1515/reveh-2015-0007. Rev Environ Health. 2015. PMID: 26368042 Review.
Cited by
-
Electrical Signaling, Photosynthesis and Systemic Acquired Acclimation.Front Physiol. 2017 Sep 14;8:684. doi: 10.3389/fphys.2017.00684. eCollection 2017. Front Physiol. 2017. PMID: 28959209 Free PMC article. Review.
References
-
- Bertholon P. De l’electricite des vegetaux. PF Didot jeune; Paris: 1783.
-
- Stahlberg R. Historical Overview on Plant Neurobiology. Plant Signal Behav 2006; 1:6-8; PMID:19521469; http://dx.doi.org/10.4161/psb.1.1.2278 - DOI - PMC - PubMed
-
- Brenner ED, Stahlberg R, Mancuso S, Vivanco J, Baluška F, Van Volkenburgh E. Plant neurobiology: an integrated view of plant signaling. Trends Plant Sci 2006; 11:413-9; PMID:16843034; http://dx.doi.org/10.1016/j.tplants.2006.06.009 - DOI - PubMed
-
- Yan X, Wang Z, Huang L, Wang C, Hou R, Xu Z, Qiao X. Research progress on electrical signals in higher plants. Prog Nat Sci 2009; 19:531-41; http://dx.doi.org/10.1016/j.pnsc.2008.08.009 - DOI
-
- Fromm J, Lautner S. Electrical signals and their physiological significance in plants. Plant, Cell Environ 2007; 30:249-57; http://dx.doi.org/10.1111/j.1365-3040.2006.01614.x - DOI - PubMed
Publication types
MeSH terms
LinkOut - more resources
Full Text Sources
Other Literature Sources