Identification of transcription factors linked to cell cycle regulation in Arabidopsis
- PMID: 25482767
- PMCID: PMC4622563
- DOI: 10.4161/15592316.2014.972864
Identification of transcription factors linked to cell cycle regulation in Arabidopsis
Abstract
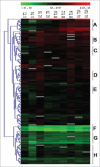
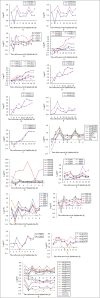
Cell cycle is an essential process in growth and development of living organisms consists of the replication and mitotic phases separated by 2 gap phases; G1 and G2. It is tightly controlled at the molecular level and especially at the level of transcription. Precise regulation of the cell cycle is of central significance for plant growth and development and transcription factors are global regulators of gene expression playing essential roles in cell cycle regulation. This study has uncovered TFs that are involved in the control of cell cycle progression. With the aid of multi-parallel quantitative RT-PCR, the expression changes of 1880 TFs represented in the Arabidopsis TF platform was monitored in Arabidopsis synchronous MM2d cells during a 19 h period representing different time points corresponding to the 4 cell cycle phases after treatment of MM2d cells with Aphidicolin. Comparative TF expression analyses performed on synchronous cells resulted in the identification of 239 TFs differentially expressed during the cell cycle, while about one third of TFs were constitutively expressed through all time points. Phase-specific TFs were also identified.
Keywords: Arabidopsis; QRT-PCR; aphidicolin; cell cycle; suspension culture; synchronization; transcription factors.
Figures


References
-
- Veylder LD, Joubès J, Inzé D. Plant cell cycle transitions. Curr Opin Plant Biol 2003; 6:536-43; PMID:14611951; http://dx.doi.org/10.1016/j.pbi.2003.09.001 - DOI - PubMed
-
- Berckmans B, De Veylder L. Transcriptional control of the cell cycle. Curr Opin Plant Biol 2009; 12:599-605; PMID:19700366; http://dx.doi.org/10.1016/j.pbi.2009.07.005 - DOI - PubMed
-
- Burssens S, Van Montagu M, Inzé D. The cell cycle in Arabidopsis. Plant Physiol Biochem 1998; 36:9-19; http://dx.doi.org/10.1016/S0981-9428(98)80087-9 - DOI
-
- Boruc J, Mylle E, Duda M, De Clercq R, Rombauts S, Geelen D, Hilson P, Inzé D, Van Damme D, Russinova E. Systematic localization of the Arabidopsis core cell cycle proteins reveals novel cell division complexes. Plant Physiol 2010; 152:553-65; PMID:20018602; http://dx.doi.org/10.1104/pp.109.148643 - DOI - PMC - PubMed
-
- Harashima H, Schnittger A. The integration of cell division, growth and differentiation. Curr Opin Plant Biol 2010; 13:66-74; PMID:19963429; http://dx.doi.org/10.1016/j.pbi.2009.11.001 - DOI - PubMed
Publication types
MeSH terms
Substances
LinkOut - more resources
Full Text Sources
Other Literature Sources
Miscellaneous
