. 2014 Dec 8:4:7348.
doi: 10.1038/srep07348.

Stability of gut enterotypes in Korean monozygotic twins and their association with biomarkers and diet

Affiliations

Stability of gut enterotypes in Korean monozygotic twins and their association with biomarkers and diet

Mi Young Lim et al. Sci Rep. .

Abstract

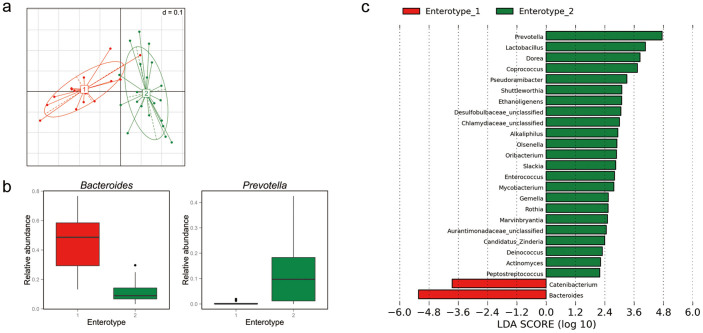
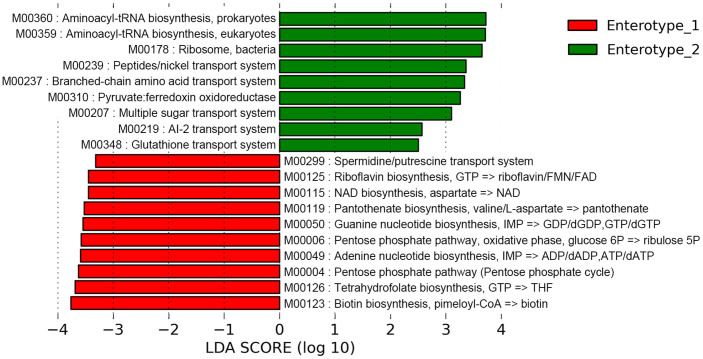
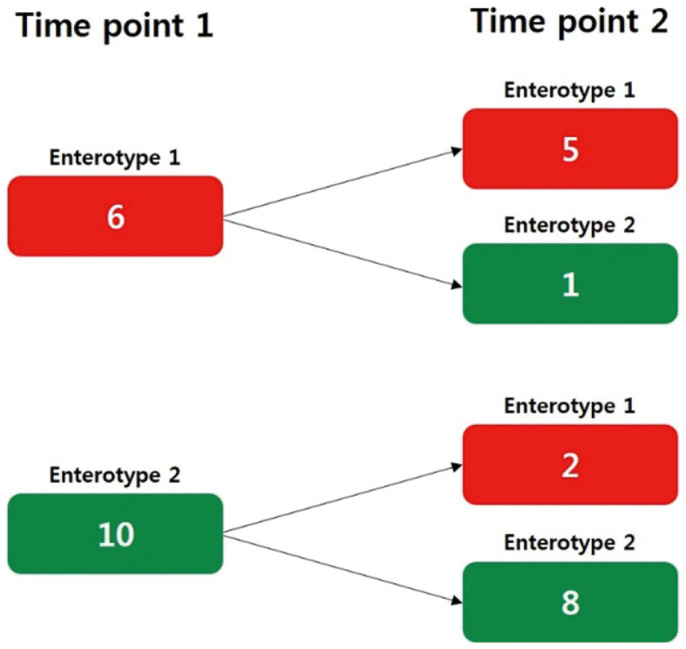
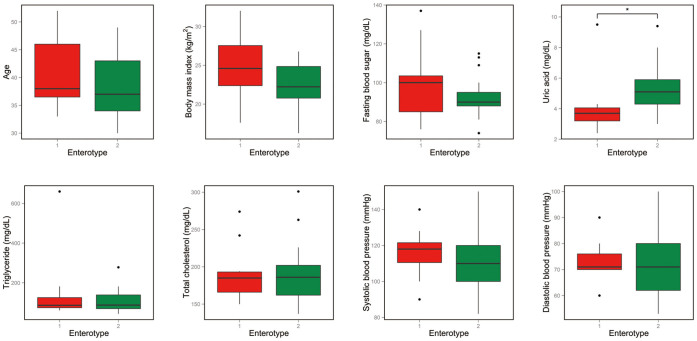
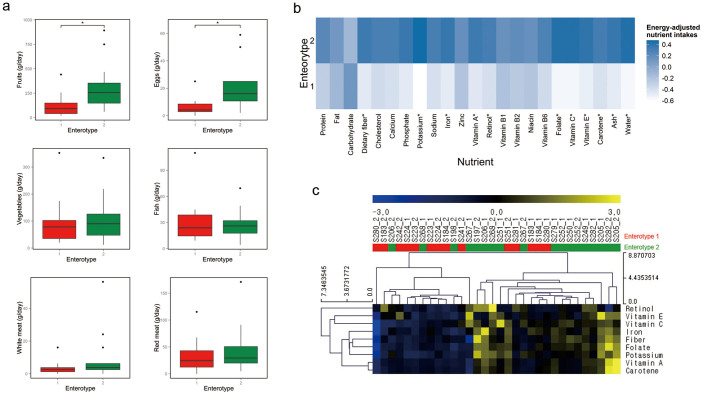
Studies on the human gut microbiota have suggested that human individuals could be categorized into enterotypes based on the compositions of their gut microbial communities. Here, we report that the gut microbiota of healthy Koreans are clustered into two enterotypes, dominated by either Bacteroides (enterotype 1) or Prevotella (enterotype 2). More than 72% of the paired fecal samples from monozygotic twin pairs were assigned to the same enterotype. Our longitudinal analysis of these twins indicated that more than 80% of the individuals belonged to the same enterotype after about a 2-year interval. Microbial functions based on KEGG pathways were also divided into two clusters. For enterotype 2, 100% of the samples belonged to the same functional cluster, while for enterotype 1, approximately half of the samples belonged to each functional cluster. Enterotype 2 was significantly associated with long-term dietary habits that were high in dietary fiber, various vitamins, and minerals. Among anthropometrical and biochemical traits, the level of serum uric acid was associated with enterotype. These results suggest that host genetics as well as host properties such as long-term dietary patterns and a particular clinical biomarker could be important contributors to the enterotype of an individual.


Figures

Figure 1
Figure 1. Identification of enterotypes in a Korean population.
(a) The first two principal coordinates of the Jensen–Shannon distances of the genus-level relative abundance profiles. Samples are colored by enterotype as identified by the partitioning around medoids (PAM) clustering algorithm. Red is enterotype 1 and green is enterotype 2. (b) Relative abundances of Bacteroides and Prevotella in each enterotype. Boxes represent the interquartile range (IQR) between the first and third quartiles, with a line at the median. (c) Histogram of the linear discriminant analysis (LDA) score for differentially abundant genera between the enterotypes. Negative (red bars) and positive (green bars) LDA scores represent genera overrepresented in enterotype 1 and enterotype 2, respectively. Features with LDA scores > 2 are presented.
Figure 2
Figure 2. Functional differences between enterotypes.
Histogram of the linear discriminant analysis (LDA) scores for differentially abundant KEGG modules between the enterotypes. Negative (red bars) and positive (green bars) LDA scores represent KEGG modules overrepresented in enterotype 1 and enterotype 2, respectively. Features with LDA scores > 2 are presented.
Figure 3
Figure 3. Persistency of enterotypes over time.
The numbers of samples assigned to each enterotype at two different time points over the 2-year period are presented.
Figure 4
Figure 4. Association of enterotypes with host properties.
The Wilcoxon rank-sum test was used to assess the association of enterotypes with age, body mass index, and clinical biomarkers (*adj. P < 0.05). Boxes represent the interquartile range (IQR) between the first and third quartiles, with a line at the median.
Figure 5
Figure 5. Association of enterotypes with long-term dietary intakes.
(a)–(b), The Wilcoxon rank-sum test was used to assess the association of (a) intakes of food items and (b) energy-adjusted nutrient intakes with the enterotypes (*adj. P < 0.05). In (a), boxes represent the interquartile range (IQR) between the first and third quartiles, with a line at the median. In (b), colors represent the mean values of the standardized residuals obtained from the regression of a specific nutrient on energy. Darker blue corresponds to higher intake of the nutrient. (c) Heat map of hierarchical clustering for only the nutrient variables shown to be significantly associated with the enterotypes in this study. Clustering was performed using Euclidean distance and an average linkage method. Red indicates enterotype 1 and green indicates enterotype 2.

References

    1. Candela M. et al. Interaction of probiotic Lactobacillus and Bifidobacterium strains with human intestinal epithelial cells: adhesion properties, competition against enteropathogens and modulation of IL-8 production. Int. J. Food Microbiol. 125, 286–292 (2008). - PubMed
    1. Turnbaugh P. et al. An obesity-associated gut microbiome with increased capacity for energy harvest. Nature 444, 1027–1031 (2006). - PubMed
    1. Cebra J. Influences of microbiota on intestinal immune system development. Am. J. Clin. Nutr 69, 1046S–1051S (1999). - PubMed
    1. Human Microbiome Project Consortium. Structure, function and diversity of the healthy human microbiome. Nature 486, 207–214 (2012). - PMC - PubMed
    1. Turnbaugh P. et al. A core gut microbiome in obese and lean twins. Nature 457, 480–484 (2009). - PMC - PubMed

Publication types