. 2014;15(12):1646-57.
doi: 10.4161/15384047.2014.967992.

Regulation of dimethyl-fumarate toxicity by proteasome inhibitors

Affiliations

Regulation of dimethyl-fumarate toxicity by proteasome inhibitors

Laurence Booth et al. Cancer Biol Ther. 2014.

Abstract

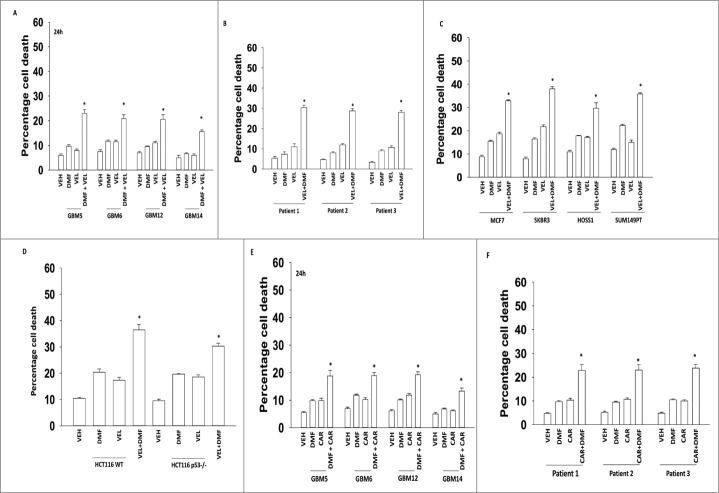
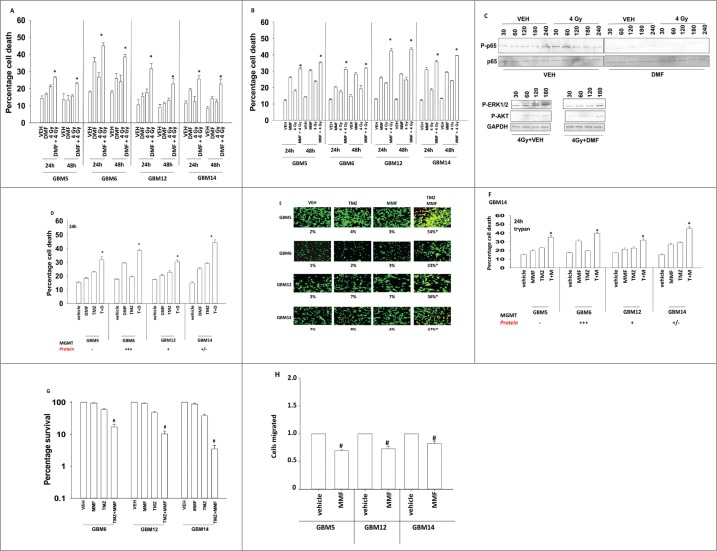
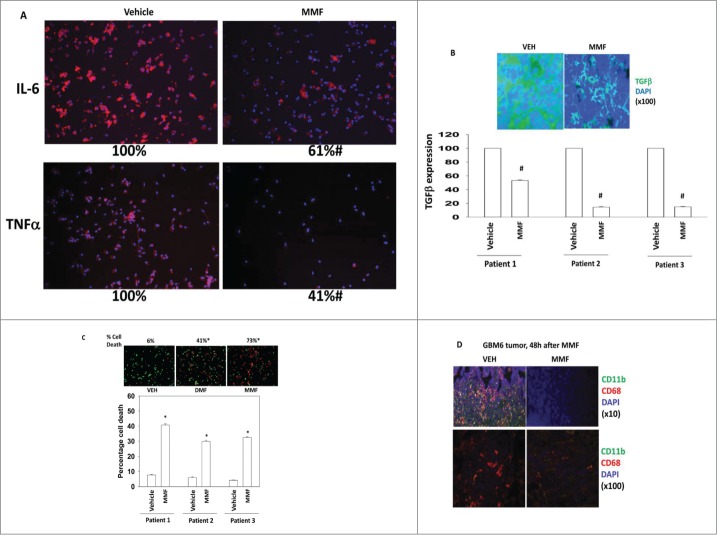
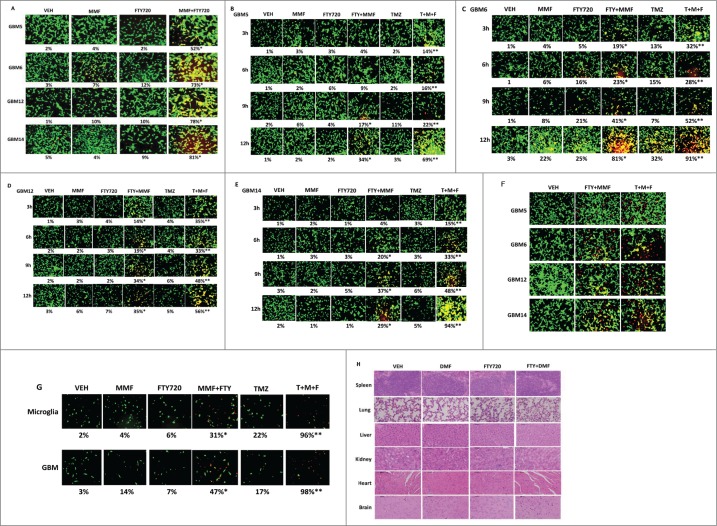
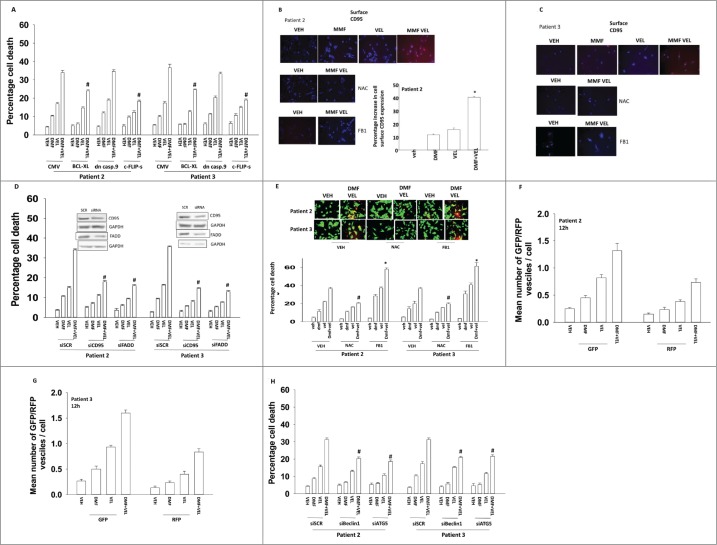
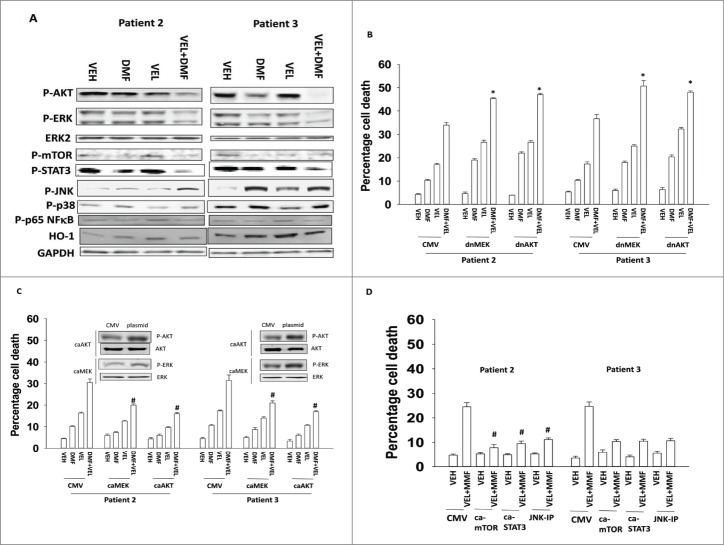
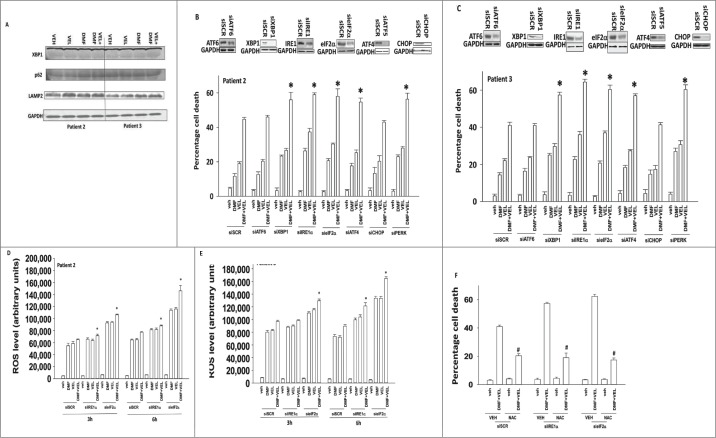
The present studies examined the biology of the multiple sclerosis drug dimethyl-fumarate (DMF) or its in vivo breakdown product and active metabolite mono-methyl-fumarate (MMF), alone or in combination with proteasome inhibitors, in primary human glioblastoma (GBM) cells. MMF enhanced velcade and carfilzomib toxicity in multiple primary GBM isolates. Similar data were obtained in breast and colon cancer cells. MMF reduced the invasiveness of GBM cells, and enhanced the toxicity of ionizing radiation and temozolomide. MMF killed freshly isolated activated microglia which was associated with reduced IL-6, TGFβ and TNFα production. The combination of MMF and the multiple sclerosis drug Gilenya further reduced both GBM and activated microglia viability and cytokine production. Over-expression of c-FLIP-s or BCL(-)XL protected GBM cells from MMF and velcade toxicity. MMF and velcade increased plasma membrane localization of CD95, and knock down of CD95 or FADD blocked the drug interaction. The drug combination inactivated AKT, ERK1/2 and mTOR. Molecular inhibition of AKT/ERK/mTOR signaling enhanced drug combination toxicity whereas molecular activation of these pathways suppressed killing. MMF and velcade increased the levels of autophagosomes and autolysosomes and knock down of ATG5 or Beclin1 protected cells. Inhibition of the eIF2α/ATF4 arm or the IRE1α/XBP1 arm of the ER stress response enhanced drug combination lethality. This was associated with greater production of reactive oxygen species and quenching of ROS suppressed cell killing.

Keywords: DMF, dimethyl-fumarate; EGF, epidermal growth factor; ERK, extracellular regulated kinase; JNK, c-Jun NH2-terminal kinase; MAPK, mitogen activated protein kinase; MEK, mitogen activated extracellular regulated kinase; MMF, monomethyl-fumarate; P, phospho-; PARP, poly ADP ribosyl polymerase; PI3K, phosphatidyl inositol 3 kinase; PTEN, Phosphatase and tensin homolog; R, receptor; WT, wild type; ca, constitutively active; dn, dominant negative; −/−, null / gene deleted.


Figures

Figure 1.
Figure 1.
DMF enhances proteasome inhibitor toxicity in tumor cells. (A) GBM5/6/12/14 cells were treated with DMF (5 μM), velcade (10 nM) or the drug combination. Cells were isolated 24 h after treatment and viability determined by trypan blue exclusion assay (n = 3, +/− SEM) *P < 0.05 greater than DMF alone. (B) Freshly isolated GBM cells (patients 1/2/3) were treated with DMF (5 μM), velcade (10 nM) or the drug combination. Cells were isolated 24 h after treatment and viability determined by trypan blue exclusion assay (n = 3, +/− SEM) *P < 0.05 greater than DMF alone. (C) Breast cancer cells (MCF7, SKBR3; SUM149PT) or primary medulloblastoma cells (HOSS1) were treated with DMF (5 μM), velcade (10 nM) or the drug combination. Cells were isolated 24 h after treatment and viability determined by trypan blue exclusion assay (n = 3, +/− SEM) *P < 0.05 greater than DMF alone. (D) HCT116 wild type and HCT116 p53 −/− colon cancer cells were treated with DMF (5 μM), velcade (10 nM) or the drug combination. Cells were isolated 24 h after treatment and viability determined by trypan blue exclusion assay (n = 3, +/− SEM) *P < 0.05 greater than DMF alone. (E) GBM5/6/12/14 cells were treated with DMF (5 μM), carfilzomib (5 nM) or the drug combination. Cells were isolated 24 h after treatment and viability determined by trypan blue exclusion assay (n = 3, +/− SEM) *P < 0.05 greater than DMF alone. (F) Freshly isolated GBM cells (patients 1/2/3) were treated with DMF (5 μM), carfilzomib (5 nM) or the drug combination. Cells were isolated 24 h after treatment and viability determined by trypan blue exclusion assay (n = 3, +/− SEM) *P < 0.05 greater than DMF alone.
Figure 2.
Figure 2.
DMF interacts with standard of care GBM therapeutics to enhance cell killing. (A) GBM5/6/ 12/14 cells were treated with DMF (5 μM) followed, as indicated, by irradiation (4 Gy). Cells were isolated 24 h and 48 h after treatment and viability determined by trypan blue exclusion assay (n = 3, +/− SEM) *P < 0.05 greater than DMF alone. (B) GBM5/6/ 12/14 cells were treated with MMF (5 μM) followed, as indicated, by irradiation (4 Gy). Cells were isolated 24 h and 48 h after treatment and viability determined by trypan blue exclusion assay (n = 3, +/− SEM) *P < 0.05 greater than DMF alone. (C) GBM6 cells were irradiated (4 Gy) in the presence of vehicle of DMF (5 μM). Cells were isolated at the indicated times and immunoblotting performed to determine the phosphorylation of p65 NFκB; ERK1/2 and AKT (n = 3). (D) GBM5/6/12/14 cells were treated with DMF (5 μM) and/or temozolomide (3 μM). Cells were isolated 24 h after treatment and viability determined by trypan blue exclusion assay (n = 3, +/− SEM) *P < 0.05 greater than DMF alone. (E) GBM5/6/12/14 cells were treated with MMF (5 μM) and/or temozolomide (3 μM). Cells were isolated 24 h after treatment and viability determined by live / dead assay where green = alive; yellow = almost dead; red = dead (n = 3, +/− SEM) *P < 0.05 greater than MMF alone. (F) GBM5/6/12/14 cells were treated with MMF (5 μM) and/or temozolomide (3 μM). Cells were isolated 24 h after treatment and viability determined by trypan blue exclusion assay (n = 3, +/− SEM) *P < 0.05 greater than MMF alone. (G) GBM6/12/14 cells that express MMGT were plated as single cells in 60 mm dishes (250–1,500 cell per dish). Twelve h after plating cells were treated with vehicle, MMF (5 μM), Temozolomide (TMZ, 3 μM) or the drugs in combination for 24 h. After 24 h the media was removed, the cells washed with drug free media and the media replaced using drug free media. Colonies were permitted to form for 10–14 days, after which time the colonies were fixed, stained and counted (n = 2 studies, in sextuplicate +/− SEM). # P < 0.05 less than TMZ alone treatment. (H) GBM5/12/14 cells were placed into chambers in 24 well plates and the migration of cells in the presence of vehicle or MMF (5 μM) was determined as in Methods (n = 3, +/− SEM) #P < 0.05 less than vehicle.
Figure 3.
Figure 3.
MMF kills freshly activated microglia from GBM tumors that is associated with reduced cytokine expression. Activated microglia were isolated from grade IV GBM tumors. (A) Cells were treated with vehicle or MMF (5 μM) and 24 h later cells examined using IHC for the expression of IL6 and TNFα (n = microglia from 3 tumors in triplicate +/− SEM) #P < 0.05 less than vehicle. (B) Cells were treated with vehicle or MMF (5 μM) and 24 h later cells examined using IHC for the expression of TGFβ (n = microglia from 3 tumors in triplicate +/− SEM) #P < 0.05 less than vehicle. (C) Upper images: activated microglia were treated with vehicle, DMF (5 μM) or MMF (5 μM) for 24 h after which they were isolated and cell viability determined by live / dead assay (n = microglia from 3 tumors in triplicate +/− SEM). Lower graph: activated microglia from 3 patients were treated with vehicle or MMF (5 μM) for 24 h after which they were isolated and cell viability determined by live / dead assay (n = 3, +/− SEM) *P < 0.05 greater than vehicle. (D) GBM6 cells (5 × 10⁵) were infused into the right caudate putamen of athymic mice. Fourteen days after infusion animals were treated with either vehicle diluent (0.08% methocel) or with diluent containing MMF 30 mg/kg BID for 2 d PO. After 48 h, animals were sacrificed, their brains fixed and sectioned in a microtone (10 μm) and immuno-histochemistry performed against CD11b and CD68 in the tumors. Sections were counter-stained with DAPI. Images are at 10× and 100× magnification of the proliferating edge of the GBM6 tumor (n = 3).
Figure 4.
Figure 4.
MMF interacts with FTY720 (Fingolimod, Gilenya) to kill GBM cells. (A) GBM cells were treated with vehicle or MMF (5 μM), FTY720 (50 nM) or both drugs in combination and viability determined 24 h later using a live / dead assay (n = 3 +/− SEM) * P < 0.05 greater than MMF alone. (B–E) GBM5, GBM6, GBM12, GBM14 cells were treated with MMF (5 μM), FTY720 (50 nM), Temozolomide (TMZ, 3 μM) or in combination as indicated for the times (3 h–12 h) as indicated. Cell viability was assessed by live / dead assay. (n = 3 +/− SEM) *P < 0.05 greater than MMF; **P < 0.05 greater than MMF+FTY720 value. (F) GBM cells were treated with MMF+FTY720 or with MMF+FTY720+TMZ for 12 h. Cells were washed free of drug, and cell growth / repopulation permitted to occur for 48 h. Cell viability was assessed by live / dead assay. (G) GBM tumors, fresh from the operating room, were gently digested and dissociated, and microglia and primary GBM cells purified. Cells were plated and 12 h after plating were treated with MMF (5 μM), FTY720 (50 nM), Temozolomide (TMZ, 3 μM) or in combination as indicated for 12 h. Cell viability was assessed by live / dead assay. (n = 3 +/− SEM) *P < 0.05 greater than MMF; **P < 0.05 greater than MMF+FTY720 value. (H) BALB/c immune competent mice were treated for 14 d with: vehicle (cremophore); DMF (75 mg/kg); FTY720 (0.6 mg/kg) or the drugs in combination. After 14 d the mice were sacrificed and their organs fixed. Sections (10 μm) or each organ were taken and stained with H&E.
Figure 5.
Figure 5.
The molecular mechanisms by which DMF/MMF and velcade interact to kill. (A) GBM cells (patient 2/3) were infected with recombinant adenoviruses to express: empty vector (CMV); the mitochondrial protective protein BCL-XL; the caspase 8 inhibitor c-FLIP-s; dominant negative caspase 9. Twenty 4 h after infection cells were treated with DMF (5 μM), velcade (10 nM) or the drug combination. Cells were isolated 24 h after treatment and viability determined by trypan blue exclusion assay (n = 3, +/− SEM) # P < 0.05 less than corresponding value in CMV infected cells. (B) GBM cells (patient 2) were treated with DMF (5 μM), velcade (10 nM) or the drug combination, or in parallel with N-acetyl cysteine (10 mM) or Fumonisin B1 (FB1, 25 μM). Cells were isolated 6 h after treatment and the cell surface levels of the death receptor CD95 determined (n = 3, +/− SEM) * P < 0.05 greater than DMF alone. (C) GBM cells (patient 3) were treated with DMF (5 μM), velcade (10 nM) or the drug combination, or in parallel with N-acetyl cysteine (10 mM) or Fumonisin B1 (FB1, 25 μM). Cells were isolated 6 h after treatment and the cell surface levels of the death receptor CD95 determined. (D) GBM cells (patient 2/3) were transfected with either a scrambled siRNA (siSCR) or siRNA molecules to knock down expression of CD95 or FADD. Thirty 6 h after transfection cells were treated with DMF (5 μM), velcade (10 nM) or the drug combination. Cells were isolated 24 h after treatment and viability determined by trypan blue exclusion assay (n = 3, +/− SEM) #P < 0.05 less than corresponding value in siSCR cells. (E) GBM cells (patients 2 and 3) were pre-treated with N-acetyl cysteine (10 mM) or fumonisin B1 (25 μM) and then treated with DMF (5 μM) and velcade (10 nM) in combination. Cells were isolated 6 h after treatment and the cell surface levels of the death receptor CD95 determined (n = 3, +/− SEM) #P < 0.05 less than corresponding value in VEH cells; *P < 0.05 greater than corresponding value in VEH cells. (F and G) GBM cells (patient 2/3) were transfected with a plasmid to express LC3-GFP-RFP. Twenty 4 h after transfection cells were treated with DMF (5 μM), velcade (10 nM) or the drug combination. Cells were examined under a fluorescent microscope (×40) 12 h after drug treatment and the numbers of intense GFP+ and RFP+ punctae determined. (H) GBM cells (patient 2/3) were transfected with either a scrambled siRNA (siSCR) or siRNA molecules to knock down expression of Beclin1 or ATG5. Thirty 6 h after transfection cells were treated with DMF (5 μM), velcade (10 nM) or the drug combination. Cells were isolated 24 h after treatment and viability determined by trypan blue exclusion assay (n = 3, +/− SEM) #P < 0.05 less than corresponding value in siSCR cells.
Figure 6.
Figure 6.
Altered signaling by ERK, AKT, mTOR, NFκB and STAT3 are associated with drug combination toxicity. (A) GBM cells (patient 2/3) were treated with DMF (5 μM), velcade (10 nM) or the drug combination. Cells were isolated 12 h after exposure and subjected to SDS PAGE followed by immunoblotting to determine the expression and phosphorylation of the indicated proteins (n = 3). (B) GBM cells (patient 2/3) were infected with recombinant adenoviruses to express empty vector (CMV); dominant negative MEK; dominant negative AKT. Twenty 4 h after infection cells were treated with DMF (5 μM), velcade (10 nM) or the drug combination. Cells were isolated 24 h after treatment and viability determined by trypan blue exclusion assay (n = 3, +/− SEM) *P < 0.05 greater than corresponding value in VEH cells. (C) GBM cells (patient 2/3) were infected with recombinant adenoviruses to express empty vector (CMV); constitutively active MEK; constitutively active AKT. Twenty 4 h after infection cells were treated with DMF (5 μM), velcade (10 nM) or the drug combination. Cells were isolated 24 h after treatment and viability determined by trypan blue exclusion assay (n = 3, +/− SEM) #P < 0.05 less than corresponding value in CMV cells. (D and E) GBM cells (patient 2/3) were transfected with empty vector plasmid (CMV) or plasmids to express constitutively active STAT3 or constitutively active mTOR. The JNK inhibitory peptide (JNK-IP) was used at 10 μM. Twenty 4 h after transfection cells were treated with DMF (5 μM), velcade (10 nM) or the drug combination. Cells were isolated 24 h after treatment and viability determined by trypan blue exclusion assay (n = 3, +/− SEM) *P < 0.05 greater than corresponding value in CMV cells.
Figure 7.
Figure 7.
Endoplasmic reticulum stress pathways regulate the cellular response to DMF and velcade treatment. (A) GBM cells (patients 2 and 3) were treated with DMF (5 μM), velcade (10 nM) or the drug combination. Cells were isolated 12 h after exposure and subjected to SDS PAGE followed by immunoblotting to determine the expression and phosphorylation of the indicated proteins (n = 3). (B) GBM cells (patient 2) and (C) GBM cells (patient 3) were transfected with siRNA molecules to knock down the expression of: ATF6; XBP-1; IRE1α; eIF2α; ATF4; CHOP or with a scrambled siRNA (siSCR). Thirty 6 h after transfection cells were treated with DMF (5 μM), velcade (10 nM) or the drug combination. Cells were isolated 24 h after treatment and viability determined by trypan blue exclusion assay (n = 3, +/− SEM) *P < 0.05 greater than corresponding value in siSCR cells. (D and E) GBM cells (patient 2/3) were transfected with siRNA molecules to knock down the expression of: IRE1α; eIF2α or with a scrambled siRNA (siSCR). Thirty 6 h after transfection cells were treated with DMF (5 μM), velcade (10 nM) or the drug combination. The levels of reactive oxygen species in cells was determined 3 h after drug exposure using DCFH-DA. Data are plotted as the –Fold increase in ROS levels, with basal DCFH-DA fluorescence subtracted (n = 3, +/− SEM) *P < 0.05 greater than corresponding value in siSCR cells. (F) GBM cells (patient 2/3) were transfected with siRNA molecules to knock down the expression of: IRE1α; eIF2α or with a scrambled siRNA (siSCR). Thirty 6 h after transfection cells were pre-treated with N-acetyl cysteine (10 mM) and then treated with DMF (5 μM), velcade (10 nM) or the drug combination. Cells were isolated 24 h after treatment and viability determined by trypan blue exclusion assay (n = 3, +/− SEM) #P < 0.05 less than corresponding value in siSCR cells.

Similar articles

Cited by

References

    1. Field KM, Rosenthal MA, Yilmaz M, Tacey M, Drummond K. Comparison between poor and long-term survivors with glioblastoma: review of an Australian data set. Asia Pac J Clin Oncol 2013; 10:153-61 [Epub ahead of print]; PMID:23701649 - PubMed
    1. Juratli TA, Schackert G, Krex D. Current status of local therapy in malignant gliomas–A clinical review of three selected approaches. Pharmacol Ther 2013; 139:341-58; PMID:23694764; http://dx.doi.org/10.1016/j.pharmthera.2013.05.003 - DOI - PubMed
    1. Belge K, Brück J, Ghoreschi K. Advances in treating psoriasis. F1000Prime Rep 2014; 6:4 eCollection. - PMC - PubMed
    1. Phillips JT, Fox RJ. BG-12 in multiple sclerosis. Semin Neurol 2013; 33:56-65; PMID:23709213; http://dx.doi.org/10.1055/s-0033-1343796 - DOI - PubMed
    1. Linker RA, Lee DH, Ryan S, Van Dam AM, Conrad R, Bista P, Zeng W, Hronowsky X, Buko A, Chollate S, et al. . Fumaric acid esters exert neuroprotective effects in neuroinflammation via activation of the Nrf2 antioxidant pathway. Brain 2011; 134:678-692; PMID:21354971; http://dx.doi.org/10.1093/brain/awq386 - DOI - PubMed

Publication types