. 2014 Dec 8:5:5685.
doi: 10.1038/ncomms6685.

Mitotic catenation is monitored and resolved by a PKCε-regulated pathway

Affiliations

Mitotic catenation is monitored and resolved by a PKCε-regulated pathway

Nicola Brownlow et al. Nat Commun. .

Abstract

Exit from mitosis is controlled by silencing of the spindle assembly checkpoint (SAC). It is important that preceding exit, all sister chromatid pairs are correctly bioriented, and that residual catenation is resolved, permitting complete sister chromatid separation in the ensuing anaphase. Here we determine that the metaphase response to catenation in mammalian cells operates through PKCε. The PKCε-controlled pathway regulates exit from the SAC only when mitotic cells are challenged by retained catenation and this delayed exit is characterized by BubR1-high and Mad2-low kinetochores. In addition, we show that this pathway is necessary to facilitate resolution of retained catenanes in mitosis. When delayed by catenation in mitosis, inhibition of PKCε results in premature entry into anaphase with PICH-positive strands and chromosome bridging. These findings demonstrate the importance of PKCε-mediated regulation in protection from loss of chromosome integrity in cells failing to resolve catenation in G2.


Figures

Figure 1
Figure 1. Knockdown of PKCε causes chromatin bridging that is associated with an increase in both metaphase and anaphase catenation.
(ac) HeLa cells that stably express mCherry-H2B and GFP-Tubulin (HeLa H2B) were imaged by time-lapse microscopy. (a) Graph showing the number of HeLa-H2B cells that enter anaphase with chromatin bridging. Cells were treated with either control siRNA or one of three different siRNAs that target PKCε (si1, si2 and si3) and imaged by time-lapse microscopy. Graph shows average of three experiments±s.e.m., n>30 per experiment, per condition. Right panel shows quantification of knockdown to show correlation between knockdown and the frequency of chromatin bridges observed, chart shows mean ±s.d. (n=3) (b) Stills taken from time-lapse imaging of HeLa-H2B cells after treatment with PKCε si1; time in minutes marked in white. (c) CLEM image of a Hela H2B cell in cytokinesis showing chromatin in red (arrowed) and juxtaposed electron micrograph sections showing details of this chromatin bridge. Top right panel shows a higher magnification of the area denoted by the white box in the far right panel, the red arrow shows electron dense chromatin bridges. (d) Immunoflourescence images of HeLa cells after treatment±PKCε siRNA showing PICH-PS (green), centromeres by ACA staining (red) and DAPI (blue). Open arrows indicate PICH-positive strands that do not colocalize with DAPI, and closed arrows indicate PICH and DAPI colocalization, stared open arrow indicates DAPI-positive bridges with no PICH staining. (e,f) PICH-PS are more persistent after PKCε knockdown or inhibition evidenced by long PICH-PS. Immunoflourescence images of DLD-1 PKCε M486A cells after treatment with NaPP1showing examples of PICH-PS that are persistent into telophase PICH-PS (red) and DAPI (blue). (f) Chart shows length of PICH-PS measured using Zen software (Zeiss), red line indicates mean length, each spot represents a single strand (n>70). (g, upper panel) Scheme to describe the basis of the catenation spread assay. (g, lower panel) Representative example images of catenation spread assay with catenated sister chromosomes starred and an example chromosome enlarged for clarity. (h) Chart shows the percentage of sister chromatids per cell with catenated chromosomes; mean shown by black line (n>30 cells, repeated three times). Scale bars, 5 μm (unless otherwise stated).
Figure 2
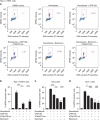
Figure 2. RPE-1 hTERT cells have an intact G2 checkpoint but this response is weak in HeLa and DLD-1 cells.
(a) RPE-1 hTERT cells have a robust G2 checkpoint shown by FACS analysis. Cells were treated for 24 h with the indicated inhibitors and analysed by FACS. Scatter charts show DNA content plotted against MPM-2 intensity to measure the number of cells that escape the G2 checkpoint into a nocodazole arrest in mitosis. The percentage of MPM-2-positive cells was analysed and plotted in bd for the three different cell lines as indicated (chart shows average of three experiments ±s.e.m., n>10,000 cells counted per condition).
Figure 3
Figure 3. Knockdown of PKCε causes cells to enter anaphase prematurely when challenged by catenation.
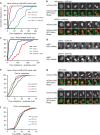
The fidelity of the metaphase catenation arrest was assessed by time-lapse microscopy. (a,b) HeLa-H2B cells were treated for 48 h±siRNA targeting PKCε. Cumulative frequency chart (a) and representative stills, time in minutes marked in white (b) showing time taken in minutes from metaphase-to-anaphase±5 μM ICRF193. (c,d) Inhibition of PKCε M486A in DLD-1 cells abrogates the metaphase catenation delay as illustrated by cumulative frequency chart (c) and representative stills (d), showing time taken in minutes from metaphase to anaphase after treatment with NaPP1±5 μM ICRF193. (eg) HeLa-H2B cells were treated with either control siRNA or one of three different siRNAs that target PKCε (si1, si2 and si3). (e,f) Cumulative frequency charts showing the time spent in either metaphase (e) or prometaphase (f), and representative stills from the time-lapse videos, time in minutes marked in white (g). For all live-cell experiments, n>30, all experiments repeated three times. Scale bars, 5 μm.
Figure 4
Figure 4. Knockdown of PKCε using siRNA does not affect the SAC arrest in DLD-1 cells.
(ad) DLD-1 cells were treated with various SAC triggers and the fidelity of the SAC arrest was measured after loss of PKCε. (a,b) DLD-1 parental cells or DLD-1 PKCε M486A cells were treated with 100 μM Monastrol±20 nM NaPP1 (a) or with PKCε si1 (b) and time taken to transit through mitosis was assayed by time-lapse microscopy by monitoring cell rounding. Charts show the number of cells that maintain a mitotic arrest for more than 7 h. (c,d) DLD-1 parental cells or DLD-1 PKCε M486A cells were treated with taxol or ICRF193 as indicated±20 nM NaPP1 or with PKCε si1 and the time taken to transit through mitosis was assayed by time-lapse video microscopy by monitoring cell rounding. The graph shows the time taken to transit through mitosis as a cumulative frequency chart. For all live-cell experiments, n>30, all experiments repeated three times.
Figure 5
Figure 5. ZW10 is actively stripped from the kinetochore when cells are delayed in metaphase using ICRF193 and this is modulated by both PKCε and dynein.
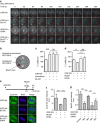
(ad) HeLa eGFP-ZW10 cells were arrested in metaphase with 10 μM ICRF193 or 250 nM nocodazole for 4 h and treated with either 100 nM Blu577 or 250 μM EHNA from the start of the video as indicated. Cells were then alternatively bleached (red circle) and imaged repeatedly, and the kinetochore intensity (blue dotted region) was fitted to a decay curve and corrected for intensity loss through imaging. (a) Representative stills from experiments. (b) Cartoon of experimental procedure. (c,d) Quantification of half-life measured during FLIP experiments as described above. Charts showing average ZW10 half-life. (n>20). (eg) HeLa cells that are arrested in metaphase with ICRF193 have high levels of CyclinB1 and kinetochore BubR1. This is lost after inhibition of PKCε using Blu 557 in a dynein-dependent manner, suggesting stripping from the kinetochore. (e) Representative images. (f,g) Quantification of integrated pixel intensity measurements of CyclinB1 (f) or BubR1±s.e.m. (g) Chart shows mean of three experiments±s.e.m., n>20 per condition per experiment. Scale bars, 5 μm.
Figure 6
Figure 6. Model of the PKCε-dependent metaphase catenation delay.
There is a catenation checkpoint at the G2-mitosis boundary, which would normally trigger resolution of excess DNA catenation before entry into mitosis. If this process fails, as is the case in some transformed cells, there is a failsafe in metaphase, which is dependent on PKCε to both implement a delay and to trigger catenation resolution. This pathway is activated when there is persistent catenation after the spindle is fully aligned at the point of mitotic exit and is effected through a dynein-dependent modulation of the SAC. In cells with both an abrogated G2 catenation checkpoint and loss of PKCε, cells exit mitosis prematurely with disjunction errors caused by sister chromatid catenation.

References

    1. Gisselsson D. et al. Chromosomal breakage-fusion-bridge events cause genetic intratumor heterogeneity. Proc. Natl Acad. Sci. USA 97, 5357–5362 (2000). - PMC - PubMed
    1. Foley E. A. & Kapoor T. M. Microtubule attachment and spindle assembly checkpoint signalling at the kinetochore. Nat. Rev. Mol. Cell. Biol. 14, 25–37 (2013). - PMC - PubMed
    1. Uhlmann F., Lottspeich F. & Nasmyth K. Sister-chromatid separation at anaphase onset is promoted by cleavage of the cohesin subunit Scc1. Nature 400, 37–42 (1999). - PubMed
    1. Toyoda Y. & Yanagida M. Coordinated requirements of human topo II and cohesin for metaphase centromere alignment under Mad2-dependent spindle checkpoint surveillance. Mol. Biol. Cell 17, 2287–2302 (2006). - PMC - PubMed
    1. Kawamura R. et al. Mitotic chromosomes are constrained by topoisomerase II-sensitive DNA entanglements. J. Cell Biol. 188, 653–663 (2010). - PMC - PubMed

Publication types

MeSH terms

LinkOut - more resources