

Transcriptome-wide N⁶-methyladenosine profiling of rice callus and leaf reveals the presence of tissue-specific competitors involved in selective mRNA modification
- PMID: 25483034
- PMCID: PMC5155352
- DOI: 10.4161/rna.36281
Transcriptome-wide N⁶-methyladenosine profiling of rice callus and leaf reveals the presence of tissue-specific competitors involved in selective mRNA modification
Abstract
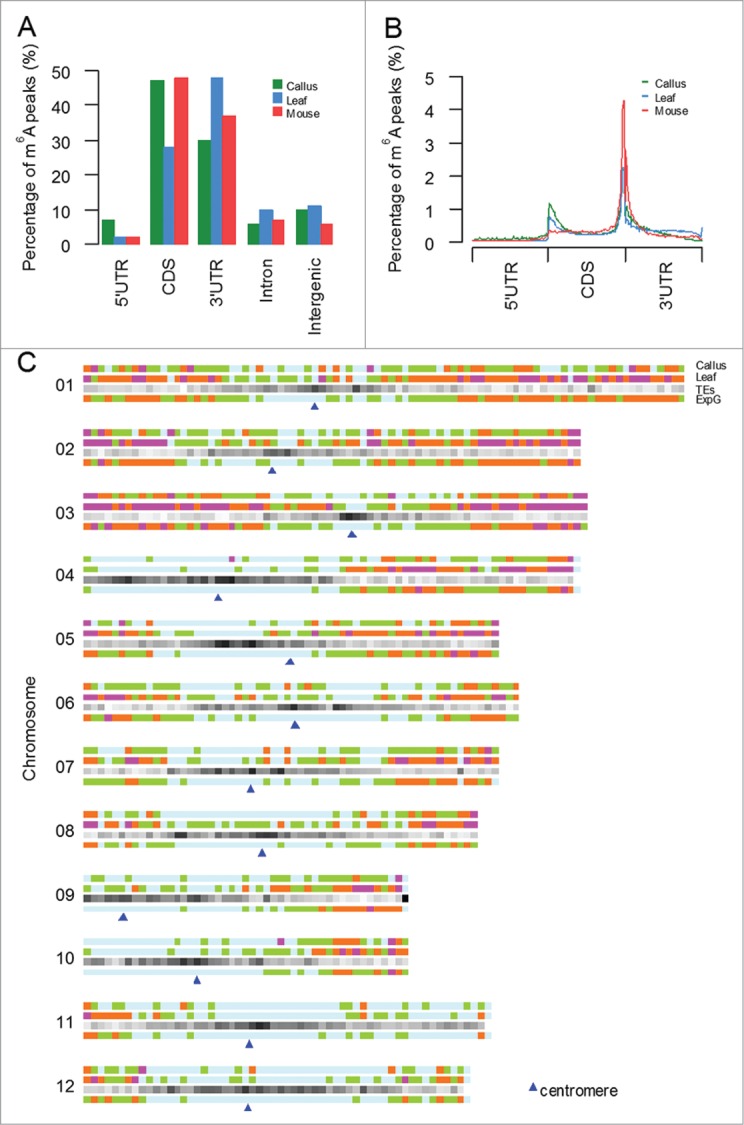
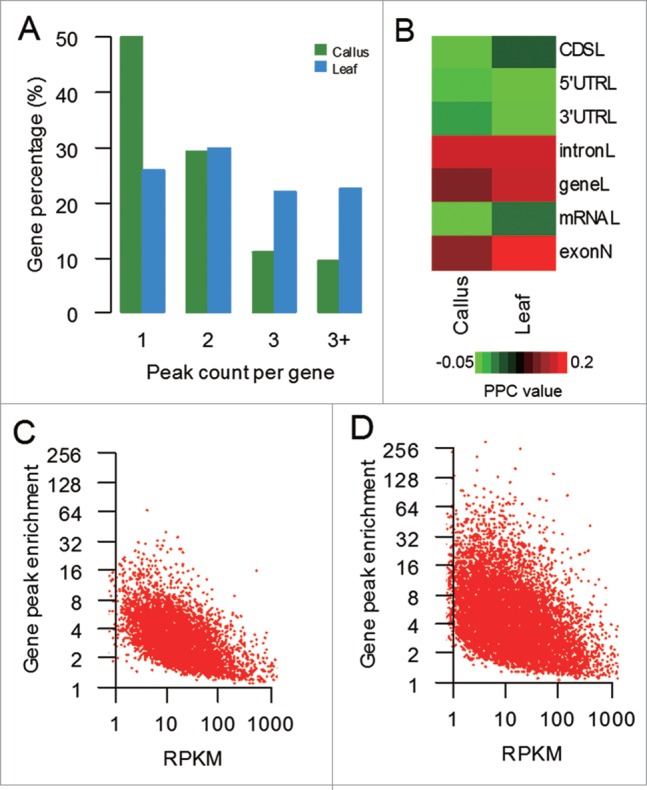
N(6)-methyladenosine (m(6)A) is the most prevalent internal modification present in mRNAs of all higher eukaryotes. With the development of MeRIP-seq technique, in-depth identification of mRNAs with m(6)A modification becomes feasible. Here we present a transcriptome-wide m(6)A modification profiling effort for rice transcriptomes of differentiated callus and leaf, which yields 8,138 and 14,253 m(6)A-modified genes, respectively. The m(6)A peak (m(6)A-modified nucleotide position on mRNAs) distribution exhibits preference toward both translation termination and initiation sites. The m(6)A peak enrichment is negatively correlated with gene expression and weakly positively correlated with certain gene features, such as exon length and number. By comparing m(6)A-modified genes between the 2 samples, we define 1,792 and 6,508 tissue-specific m(6)A-modified genes (TSMGs) in callus and leaf, respectively. Among which, 626 and 5,509 TSMGs are actively expressed in both tissues but are selectively m(6)A-modified (SMGs) only in one of the 2 tissues. Further analyses reveal characteristics of SMGs: (1) Most SMGs are differentially expressed between callus and leaf. (2) Two conserved RNA-binding motifs, predicted to be recognized by PUM and RNP4F, are significantly over-represented in SMGs. (3) GO enrichment analysis shows that SMGs in callus mainly participate in transcription regulator/factor activity whereas SMGs in leaf are mainly involved in plastid and thylakoid. Our results suggest the presence of tissue-specific competitors involved in SMGs. These findings provide a resource for plant RNA epitranscriptomic studies and further enlarge our knowledge on the function of RNA m(6)A modification.
Keywords: BPTM, bases per 10 millions of reads; MeRIP-seq; N6-methyladenosine; RNA epitranscriptomic; RNA m6A modification; RPKM, reads per kilo base per million mapped reads; SMG, selective methylated gene; TSMG, tissue specific methylated gene; rice.
Figures

References
-
- Dunn DB, Smith JD. Occurrence of a new base in the deoxyribonucleic acid of a strain of bacterium-Coli. Nature 1955; 175:336-7; PMID:13235889; http://dx.doi.org/ 10.1038/175336a0 - DOI - PubMed
-
- Jeltsch A, Pingoud A. Horizontal gene transfer contributes to the wide distribution and evolution of type II restriction-modification systems. J Mol Evol 1996; 42:91-6; PMID:8919860; http://dx.doi.org/ 10.1007/BF02198833 - DOI - PubMed
-
- Beemon K, Keith J. Localization of N6-methyladenosine in the Rous sarcoma virus genome. J Mol Biol 1977; 113:165-79; PMID:196091; http://dx.doi.org/ 10.1016/0022-2836(77)90047-X - DOI - PubMed
-
- Adams JM, Cory S. Modified nucleosides and bizarre 5'-termini in mouse myeloma mRNA. Nature 1975; 255:28-33; PMID:1128665; http://dx.doi.org/ 10.1038/255028a0 - DOI - PubMed
-
- Levis R, Penman S. 5'-terminal structures of poly(A)+ cytoplasmic messenger RNA and of poly(A)+ and poly(A)- heterogeneous nuclear RNA of cells of the dipteran Drosophila melanogaster. J Mol Biol 1978; 120:487-515; PMID:418182; http://dx.doi.org/ 10.1016/0022-2836(78)90350-9 - DOI - PubMed
Publication types
MeSH terms
Substances
LinkOut - more resources
Full Text Sources
Other Literature Sources
Research Materials
Miscellaneous