Review
. 2015 Feb:23:133-40.
doi: 10.1016/j.mib.2014.11.011. Epub 2014 Dec 5.

Quantitative bacterial transcriptomics with RNA-seq

Affiliations
Review

Quantitative bacterial transcriptomics with RNA-seq

James P Creecy et al. Curr Opin Microbiol. 2015 Feb.

Abstract

RNA sequencing has emerged as the premier approach to study bacterial transcriptomes. While the earliest published studies analyzed the data qualitatively, the data are readily digitized and lend themselves to quantitative analysis. High-resolution RNA sequence (RNA-seq) data allows transcriptional features (promoters, terminators, operons, among others) to be pinpointed on any bacterial transcriptome. Once the transcriptome is mapped, the activity of transcriptional features can be quantified. Here we highlight how quantitative transcriptome analysis can reveal biological insights and briefly discuss some of the challenges to be faced by the field of bacterial transcriptomics in the near future.


Figures

Figure 1
Figure 1
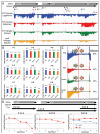
Transcriptional feature map and analysis of the cysK-ptsHI-crr operon. The dRNA-seq data are available at GEO, GSE58556. (A) The genes and feature locations are drawn to scale and annotated to the positive strand of the E. coli MG1655 U00096.3 reference genome. Promoters (P) are indicated by an arrow and are numbered in order from left to right on the positive strand. Terminators (T) are indicated by a diamond. The base count data, consisting of TEX-treated samples pointing up and unenriched coverage data (fragmented RNA not treated with TEX) pointing down, are visualized in J-Browse [14], as described previously [4]. Only positive strand data are shown. Tracks: wild type (WT), glucose-grown E. coli K-12 in logarithmic phase (blue track); WT in stationary phase, 30 min after exhaustion of glucose (red track); WT starved for nitrogen (green track); and an isogenic rpoS mutant starved for nitrogen (tan track). The base count scale (on the left) is from 0 to 100, with values exceeding 100 indicated by dark red. (B) The relative activities of the nine promoters is plotted in the graphs as log2 average counts of the first 10 transcribed bases under the four different growth conditions, which are colorized as above. (c) The decrease in average counts of the 25 bases before and after the terminator T-A are shown by light green and pink arrows. (D) Time series analysis of the relative expression levels of three transcripts within the complex cysK-ptsHI-crr operon is plotted as the log2 average counts of bases from the indicated promoters to terminators, as described previously [4]. Time point 1 is during middle logarithmic phase, time point 2 is immediately prior to entry into stationary phase, time point 3 is 15 min after entry into stationary phase, time point 4 is 30 min after entry into stationary phase, and time point 5 is 180 min after entry into stationary phase. Additional details of the analysis are described in the text.

References

    1. Croucher NJ, Thomson NR. Studying bacterial transcriptomes using RNA-seq. Curr Opin Microbiol. 2010;13:619–624. - PMC - PubMed
    1. Sharma CM, Vogel J. Differential RNA-seq: the approach behind and the biological insight gained. Curr Opin Microbiol. 2014;19:97–105. - PubMed
    1. Cho BK, Zengler K, Qiu Y, Park YS, Knight EM, Barrett CL, Gao Y, Palsson BO. The transcription unit architecture of the Escherichia coli genome. Nat Biotechnol. 2009;27:1043–1049. - PMC - PubMed
    1. Conway T, Creecy JP, Maddox SM, Grissom JE, Conkle TL, Shadid TM, Teramoto J, San Miguel P, Shimada T, Ishihama A, et al. Unprecedented high-resolution view of bacterial operon architecture revealed by RNA sequencing. MBio. 2014;5:e01442–01414. - PMC - PubMed
    1. Li S, Dong X, Su Z. Directional RNA-seq reveals highly complex condition-dependent transcriptomes in E. coli K12 through accurate full-length transcripts assembling. BMC Genomics. 2013;14:520. - PMC - PubMed

Publication types

MeSH terms