

Characterizing the limits of MRI near metallic prostheses
- PMID: 25483410
- PMCID: PMC4457712
- DOI: 10.1002/mrm.25540
Characterizing the limits of MRI near metallic prostheses
Abstract
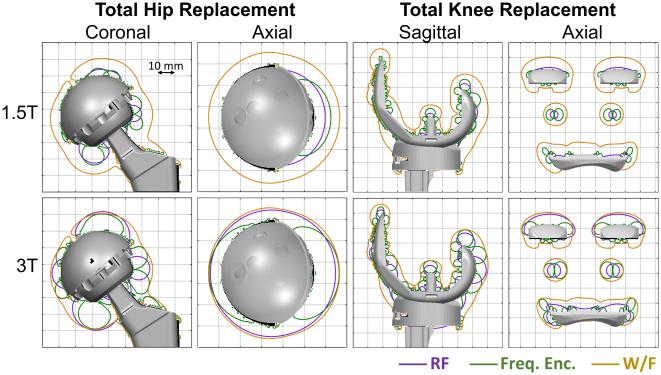
Purpose: To characterize the fundamental limits of MRI near metallic implants on RF excitation, frequency encoding, and chemical shift-encoding water-fat separation.
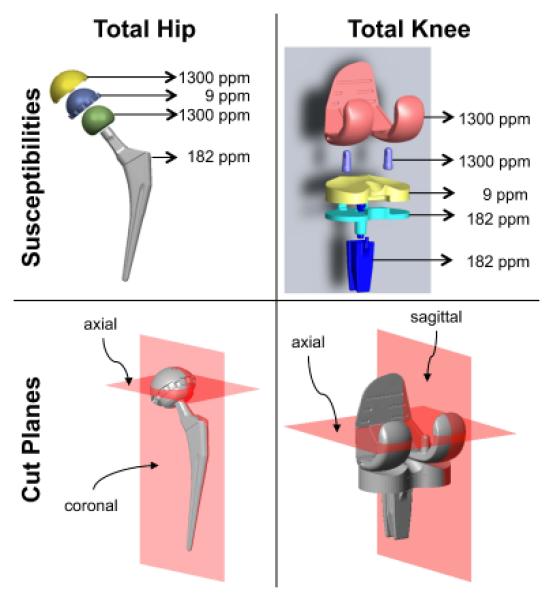
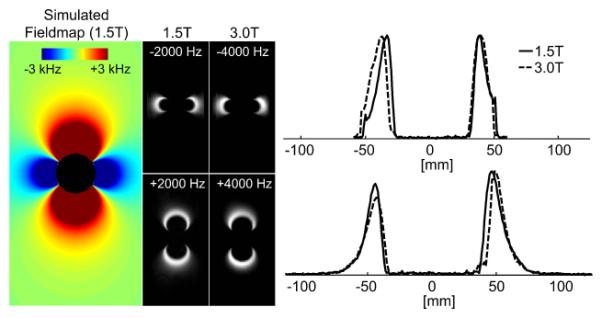
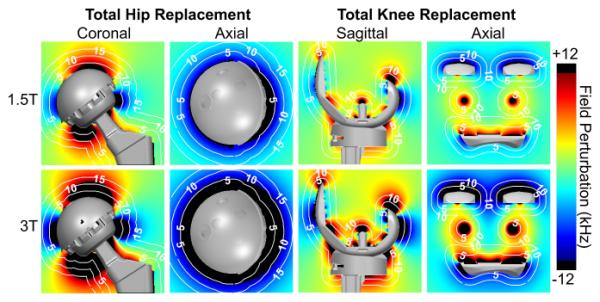
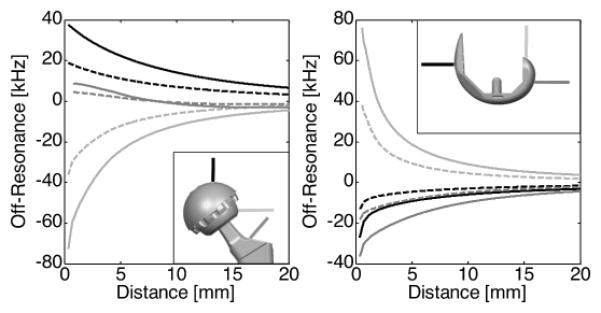
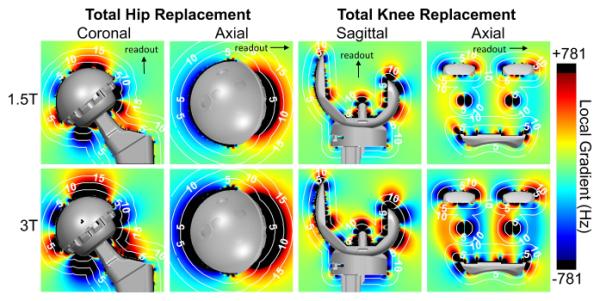
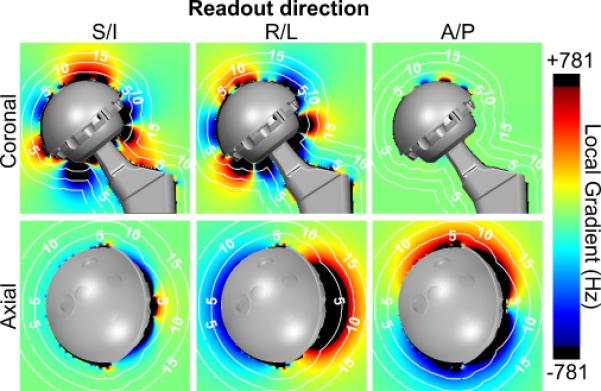
Methods: Multicomponent three-dimensional (3D) digital models of a total hip and a total knee replacement were used to construct material-specific susceptibility maps. The fundamental limits and spatial relationship of imaging near metallic prostheses were investigated as a function of distance from the prosthetic surface by calculating 3D field map perturbations using a well-validated k-space based dipole kernel.
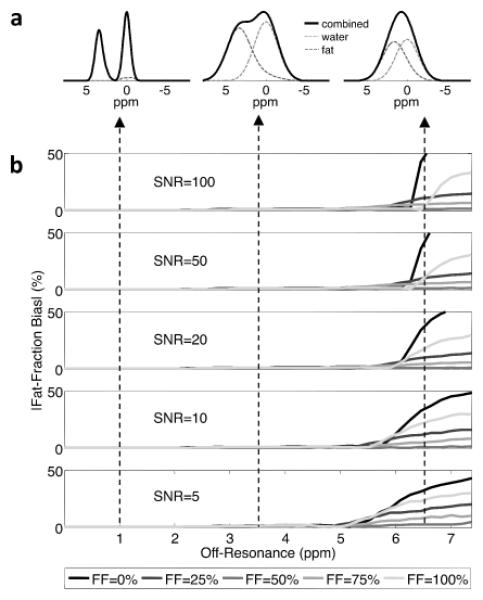
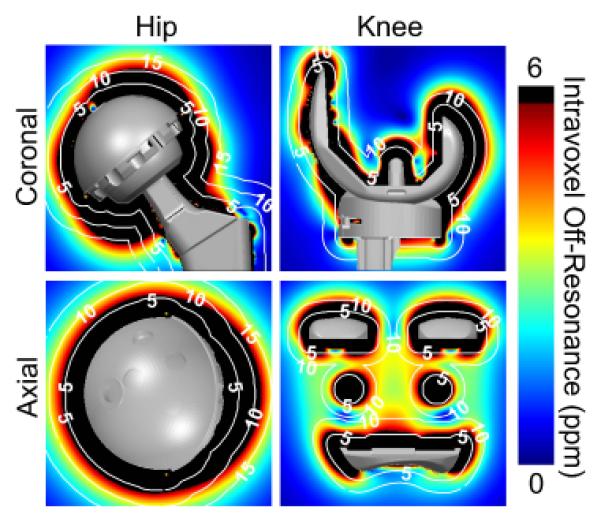
Results: Regions limited by the bandwidth of RF excitation overlap substantially with those fundamentally limited by frequency encoding. Rapid breakdown of water-fat separation occurs once the intravoxel off-resonance exceeds ∼6 ppm over a full range of fat fractions (0%-100%) and SNR (5-100).
Conclusion: Current 3D multispectral imaging methods would not benefit greatly from exciting spins beyond ±12 kHz despite the presence of signal that lies outside of this range from tissue directly adjacent to the metallic implants. Methods such as phase encoding in all three spatial dimensions are necessary to spatially resolve spins beyond an excitation bandwidth of ±12 kHz. The approach described in this study provides a benchmark for the capabilities of current imaging techniques to guide development of new MRI methods for imaging near metal.
Keywords: B0 inhomogeneity; magnetic resonance imaging; metallic implants; off-resonance; prostheses; water-fat separation.
© 2014 Wiley Periodicals, Inc.
Figures
Similar articles
-
Accelerating fully phase-encoded MRI near metal using multiband radiofrequency excitation.Magn Reson Med. 2017 Mar;77(3):1223-1230. doi: 10.1002/mrm.26209. Epub 2016 Mar 28. Magn Reson Med. 2017. PMID: 27052204 Free PMC article.
-
Effects on MRI due to altered rf polarization near conductive implants or instruments.Med Phys. 2006 Jan;33(1):124-7. doi: 10.1118/1.2132571. Med Phys. 2006. PMID: 16485418
-
A multispectral three-dimensional acquisition technique for imaging near metal implants.Magn Reson Med. 2009 Feb;61(2):381-90. doi: 10.1002/mrm.21856. Magn Reson Med. 2009. PMID: 19165901
-
MR Imaging with Metal-suppression Sequences for Evaluation of Total Joint Arthroplasty.Radiographics. 2016 Jan-Feb;36(1):209-25. doi: 10.1148/rg.2016150075. Epub 2015 Nov 20. Radiographics. 2016. PMID: 26587889 Review.
-
Advances in Metal Artifact Reduction Techniques for Periprosthetic Soft Tissue Imaging.Semin Musculoskelet Radiol. 2015 Sep;19(4):328-34. doi: 10.1055/s-0035-1563734. Epub 2015 Nov 19. Semin Musculoskelet Radiol. 2015. PMID: 26583361 Review.
Cited by
-
Externally calibrated parallel imaging for 3D multispectral imaging near metallic implants using broadband ultrashort echo time imaging.Magn Reson Med. 2017 Jun;77(6):2303-2309. doi: 10.1002/mrm.26327. Epub 2016 Jul 12. Magn Reson Med. 2017. PMID: 27403613 Free PMC article.
-
2D multi-spectral imaging for fast MRI near metal.Magn Reson Med. 2018 Feb;79(2):968-973. doi: 10.1002/mrm.26724. Epub 2017 Apr 25. Magn Reson Med. 2018. PMID: 28444805 Free PMC article.
-
A Novel Magnetic Resonance Imaging-Compatible Titanium Alloy Wire-Reinforced Endotracheal Tube.Materials (Basel). 2022 Aug 16;15(16):5632. doi: 10.3390/ma15165632. Materials (Basel). 2022. PMID: 36013768 Free PMC article.
-
Heating of hip joint implants in MRI: The combined effect of RF and switched-gradient fields.Magn Reson Med. 2021 Jun;85(6):3447-3462. doi: 10.1002/mrm.28666. Epub 2021 Jan 22. Magn Reson Med. 2021. PMID: 33483979 Free PMC article.
-
An illustrative review to understand and manage metal-induced artifacts in musculoskeletal MRI: a primer and updates.Skeletal Radiol. 2016 May;45(5):677-88. doi: 10.1007/s00256-016-2338-2. Epub 2016 Feb 2. Skeletal Radiol. 2016. PMID: 26837388 Review.
References
-
- Centers for Disease Control National Center for Health Statistics FastStats inpatient surgery. http://wwwcdcgov/nchs/fastats/insurghtm; Accessed February 19, 2013.
-
- Kurtz S, Mowat F, Ong K, Chan N, Lau E, Halpern M. Prevalence of primary and revision total hip and knee arthroplasty in the United States from 1990 through 2002. J Bone Joint Surg Am. 2005;87(7):1487–1497. - PubMed
-
- Kurtz S, Ong K, Lau E, Mowat F, Halpern M. Projections of primary and revision hip and knee arthroplasty in the United States from 2005 to 2030. J Bone Joint Surg Am. 2007;89(4):780–785. - PubMed
-
- Schenck JF. The role of magnetic susceptibility in magnetic resonance imaging: MRI magnetic compatibility of the first and second kinds. Med Phys. 1996;23(6):815–850. - PubMed
-
- Koch KM, King KF, Carl M, Hargreaves BA. Imaging near metal: The impact of extreme static local field gradients on frequency encoding processes. Magn Reson Med. 2014;71(6):2024–2034. - PubMed
Publication types
MeSH terms
Substances
Grants and funding
LinkOut - more resources
Full Text Sources
Other Literature Sources
Medical
