

doi: 10.4161/hv.28886.
Active specific immunotherapy: using tumor heterogeneity to successfully fight cancer
Affiliations
- PMID: 25483649
- PMCID: PMC4514058
- DOI: 10.4161/hv.28886
Item in Clipboard
Active specific immunotherapy: using tumor heterogeneity to successfully fight cancer
Hum Vaccin Immunother.
2014.
No abstract available
Keywords: Bacillus Calmette Guerin (BCG); T-cell responses; active specific immunotherapy; colon tumor; delayed-typed hypersensitivity; human monoclonal antibodies; tumor heterogeneity; tumor immunity; tumor-associated antigens.
Figures

(A) Time-lapse cinematography of transplantable, L 10 hepatocarcinoma of syngeneic Strain 2 guinea pigs with 3 peritoneal monocytes from L 10 immune animals. Note the extensions from the monocytes (clasmatosis) (B) Implosion of the tumor cell. (C) Cytoplasm from tumor cell being phagocytized by macrophages.

(A) A lysosome trapped between a monocyte and tumor cell. (B) Lysosome like organelle vacuoles in monocyte and organelle in tumor cell. (C) An extension from the monocyte to and possible into the tumor cell. Intracytoplasmic organelles in the probing extension. (D) Schematic of the several ways the lysomomal organelles can be transferred from activated or immune monocytes to the tumor cells.

In the 2 rectangles on the right, cancer vaccine candidates on the left and declared failed candidates, blue letters, on the right. Both of these used to treat patients with advanced disease. OncoVAX an autologous tumor cell vaccine used to treat occult disease on the left.
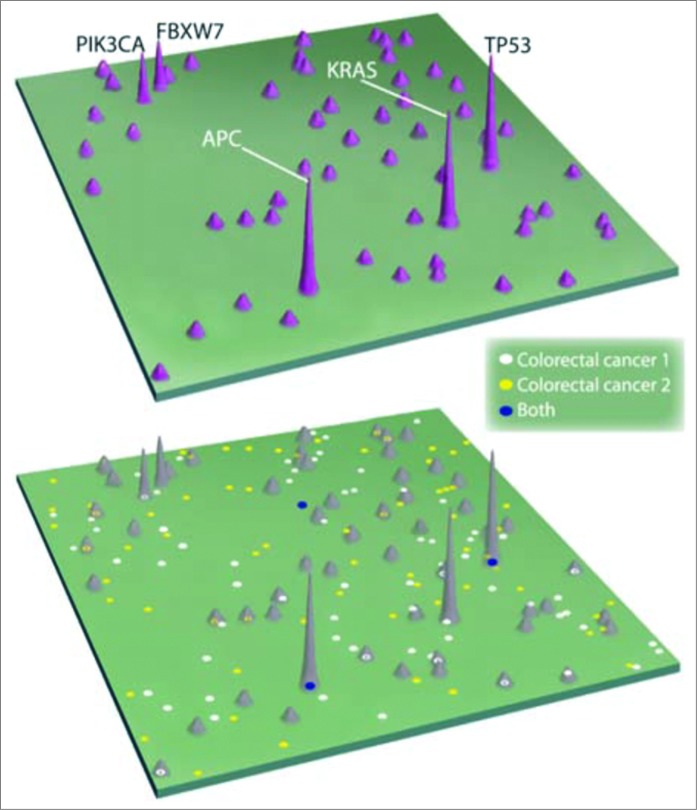
Genomic Landscape of Colorectal Cancer. Wood, L and B. Vogelstein, Science Vol. 318, November, 2007. A two-dimensional map of genes mutated in colorectal cancers, in which a few genes “mountains” are mutated in a large proportion of tumors while most are mutated infrequently. The mutations in 2 individual tumors are indicated in the lower map. Note that only 3 mutations (blue dots on bottom landscape) were common to both tumors indicating a potential for weak common immunogenicity.

Heterogeneity within primary tumors. Metastatic subclones giving rise to liver and lung metastasis are non-randomly located within slice 3, indicated by blue circles. The clones are both geographically and genetically distinct from clones giving rise to peritoneal metastasis in this same patient, indicated in green. Yachida, et al., Nature 467: 114, 2010.
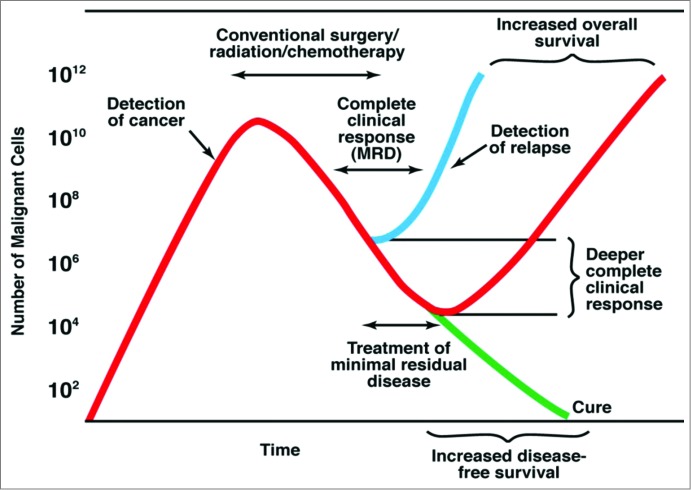
Best Hope for Significant Progress with Solid Tumors is via Treatment of Minimal Residual Disease.

Induction of a DTH response following injection of autogous tumor cells. Hoover HC, Surdyke, M, Dangle, RB, Peters, LC, Hanna, Jr. MG. (1984) Delayed Cutaneous Hypersensitivity to Autologous Tumor Cells in Colorectal Cancer Patients immunized with an Autologous Tumor Cell: Bacillus Calmette-Guerin Vaccine. Cancer Res. 44, 1671–1676. (A) DTH response specific to tumor, not adjacent mucous. DTH in 27 patients and 11 Controls Responses to Tumor or Colon Mucosa. (B) DTH response to 3rd and 4th vaccine Dose.

Survival and disease-free survival in patients grouped according to their DTH response to the third vaccine. Harris JE, Ryan L, Hoover Jr HC, Stuart RK, Oken MM, Benson AB, Mansour EG, Haller DG, Manola J, Hanna Jr MG (2000) Adjuvant active specific immunotherapy of stage II and III colon cancer with an autologous tumor cell vaccine: ECOG Study E5283. Journal of Clinical Oncology, 18 148–157. In the ECOG study 5283, there was inadequate quality control of the vaccine specifications and a percentage of the patients received inadequate vaccines, based on the potency with respect to live tumor cell count. This inadequate potency among a group of vaccines was reflected in failure to induce a significant T-cell mediated immune response as measured by DTH. This lack of vaccine potency correlated with clinical benefit as reflected in significant differences in recurrence-free- and overall-survival.

OncoVAX® – Clinical Results 8701 Study – Recurrence -Free Survival* in Stage II Patients The results were published in the British Medical Journal The Lancet January 30, 1999; 353: 345–350.

OncoVAX® – Clinical Results 8701 Study – Overall Survival in Stage II Patients. Trends toward efficacy in OS was not statistically significant in the full intent-to-treat population. A pre-specified stratification of the trial to analyze by tumor stage demonstrated that Stage II patients separately reached statistical significance with a p value of 0.014 on a 5 y analysis.

OncoVAX® – Clinical Results 8701 Study – Recurrence-Free Interval in Stage II Patients. Greatest difference between treated and control in RFI at 18 mo post Vx.

OncoVAX® – Clinical Results 15 y F/U 8701 Study – Recurrence-Free Interval (RFI) in Stage II Patients. Recurrence Free Interval original study population. Survival time in years on the X-axis and the percentage Recurrence Free Interval on the Y-axis. Kaplan-Meier curves, comparing ASI with the control group in the original study population (n = 254), show a significant better prognosis for patients who received adjuvant ASI therapy. (ASI vs. Control at 15 y follow up; HR = 0.62 (95% CI: 0.34–0.96) log rank p-value 0.033) . de Weger, Vincent A, et al., Clinical effects of Adjuvant Active Specific Immunotherapy differ between Patients with Microsatellite Stable and Microsatellite Instable Colon Cancer, Clin Cancer Res 2012Feb1; 18:3882–9.

Distribution of epitopes as detected by human monoclonal antibodies (MCA). Distribution of antigens in paraffin sections of colorectal tumors. Shaded areas indicates positive indirect immunoperoxidase staining of 15 tumors by 10 Human MCA.

Reactivity of 2 human monoclonal antibodies (MCA). Two MCA react with most colorectal tumors. The reactivity of 2 MCA to paraffin of 15 colorectal tumors and air-dried Cytospin preparations of dissociated tumors from 9 patients are compared. Shaded area: positive indirect immunoperoxidase staining.
Similar articles
-
Strategies for immunotherapy of cancer.Adv Immunol. 2000;75:235-82. doi: 10.1016/s0065-2776(00)75006-1. Adv Immunol. 2000. PMID: 10879286 Review. No abstract available.
-
Tumor-specific antigens and immunologic adjuvants in cancer immunotherapy.Cancer J. 2011 Sep-Oct;17(5):325-30. doi: 10.1097/PPO.0b013e3182326004. Cancer J. 2011. PMID: 21952282 Review.
-
Human Tumor Antigens and Cancer Immunotherapy.Biomed Res Int. 2015;2015:948501. doi: 10.1155/2015/948501. Epub 2015 Jun 16. Biomed Res Int. 2015. PMID: 26161423 Free PMC article. Review.
-
Prostate cancer vaccines: current status.Semin Oncol. 1999 Apr;26(2):192-201. Semin Oncol. 1999. PMID: 10597730 Review.
-
Tumor immunology top 10 list.Immunol Rev. 2008 Apr;222:5-8. doi: 10.1111/j.1600-065X.2008.00623.x. Immunol Rev. 2008. PMID: 18363991 No abstract available.
Cited by
-
Anti-Gr-1 Antibody Provides Short-Term Depletion of MDSC in Lymphodepleted Mice with Active-Specific Melanoma Therapy.Vaccines (Basel). 2022 Apr 4;10(4):560. doi: 10.3390/vaccines10040560. Vaccines (Basel). 2022. PMID: 35455309 Free PMC article.
-
A key to the backdoor into the castle: The clinical ramifications of immunoediting driven by antigenic competition.Hum Vaccin Immunother. 2017 Jul 3;13(7):1579-1585. doi: 10.1080/21645515.2017.1301337. Epub 2017 Mar 24. Hum Vaccin Immunother. 2017. PMID: 28340323 Free PMC article. Review.
-
Therapeutic Cancer Vaccines in Colorectal Cancer: Platforms, Mechanisms, and Combinations.Cancers (Basel). 2025 Aug 6;17(15):2582. doi: 10.3390/cancers17152582. Cancers (Basel). 2025. PMID: 40805277 Free PMC article.
References
-
- Couzin-Frankel J. Breakthrough of the year 2013. cancer immunotherapy. Science 2013; 342:1432-3; PMID:24357284; http://dx.doi.org/10.1126/science.342.6165.1432 - DOI - PubMed
-
- Bucana C, Hoyer LC, Hobbs B, Breesman S, McDaniel M, Hanna MG, Jr. Morphological evidence for the translocation of lysosomal organelles from cytotoxic macrophages into the cytoplasm of tumor target cells. Cancer Res 1976; 36:4444-58; PMID:187323 - PubMed
-
- Hanna MG, Jr, Bucana C, Hobbs B, Fidler IJ. Morphologic aspects of tumor cell cytotoxicity by effector cells of the macrophage-histiocyte compartment: In vitro and in vivo studies in BCG-mediated tumor regression. In Macrophage in Neoplasia. Fink M, ed Academic Press; (1976); 113-133.
-
- Cohn ZA. The structure and function of monocytes and macrophages. Adv Immunol 1968; 9:163-214; PMID:4883741; http://dx.doi.org/10.1016/S0065-2776(08)60443-5 - DOI - PubMed
-
- Cohn ZA. Macrophage physiology. Fed Proc 1975; 34:1725-9; PMID:1093890 - PubMed
MeSH terms
Substances
LinkOut - more resources
Full Text Sources
Other Literature Sources