

Imaging of amide proton transfer and nuclear Overhauser enhancement in ischemic stroke with corrections for competing effects
- PMID: 25483870
- PMCID: PMC4303585
- DOI: 10.1002/nbm.3243
Imaging of amide proton transfer and nuclear Overhauser enhancement in ischemic stroke with corrections for competing effects
Abstract
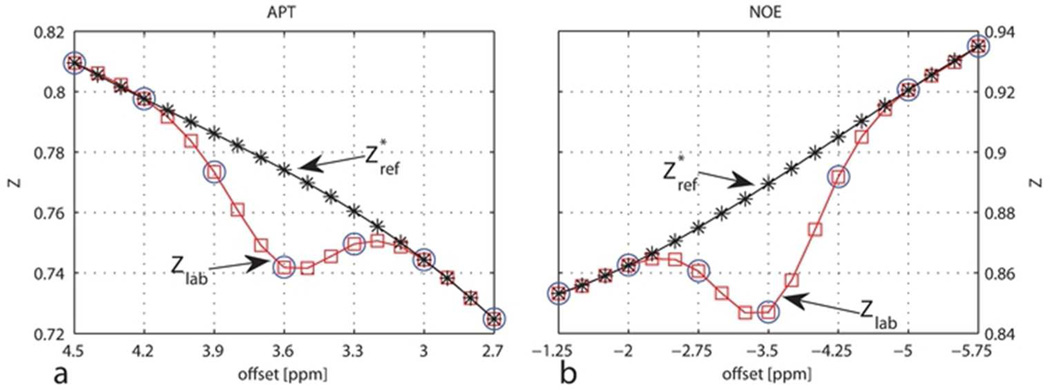
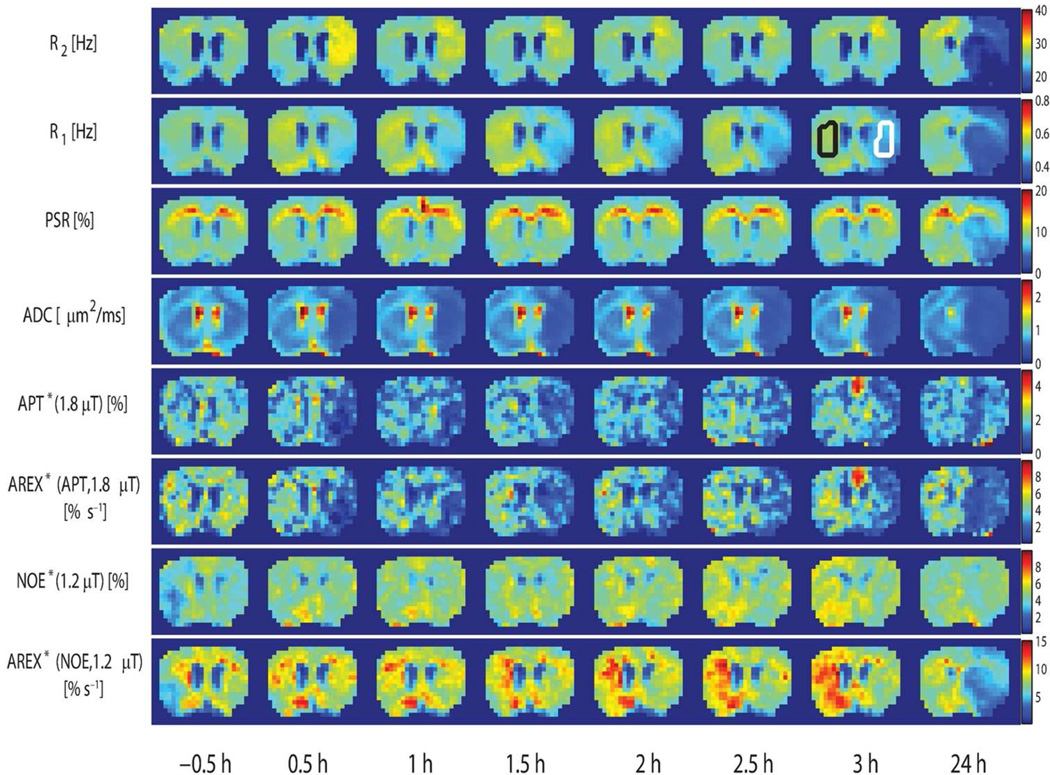
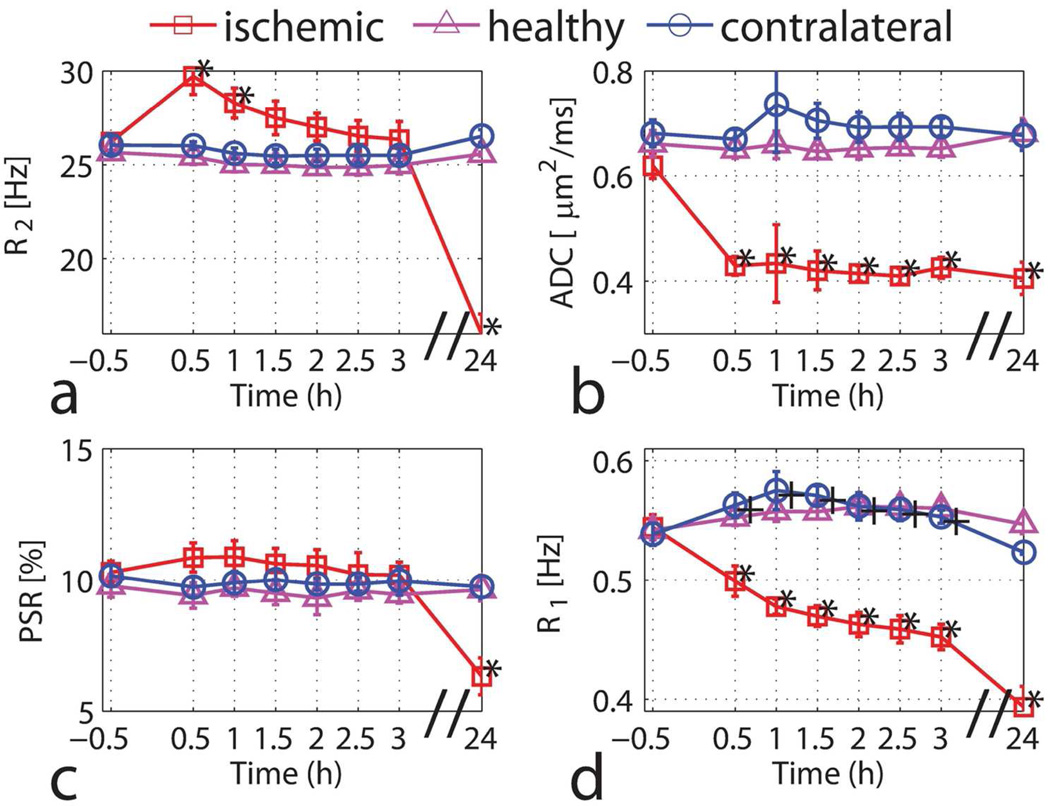
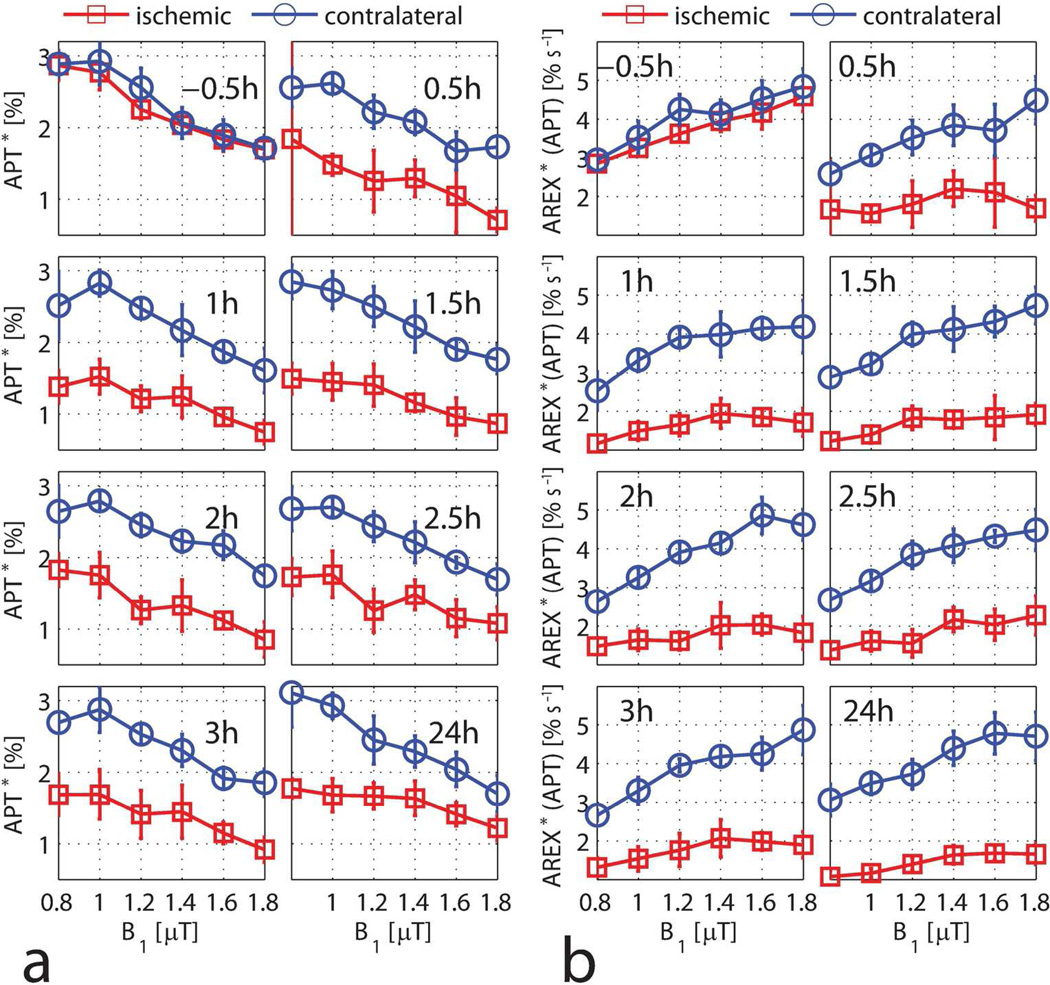
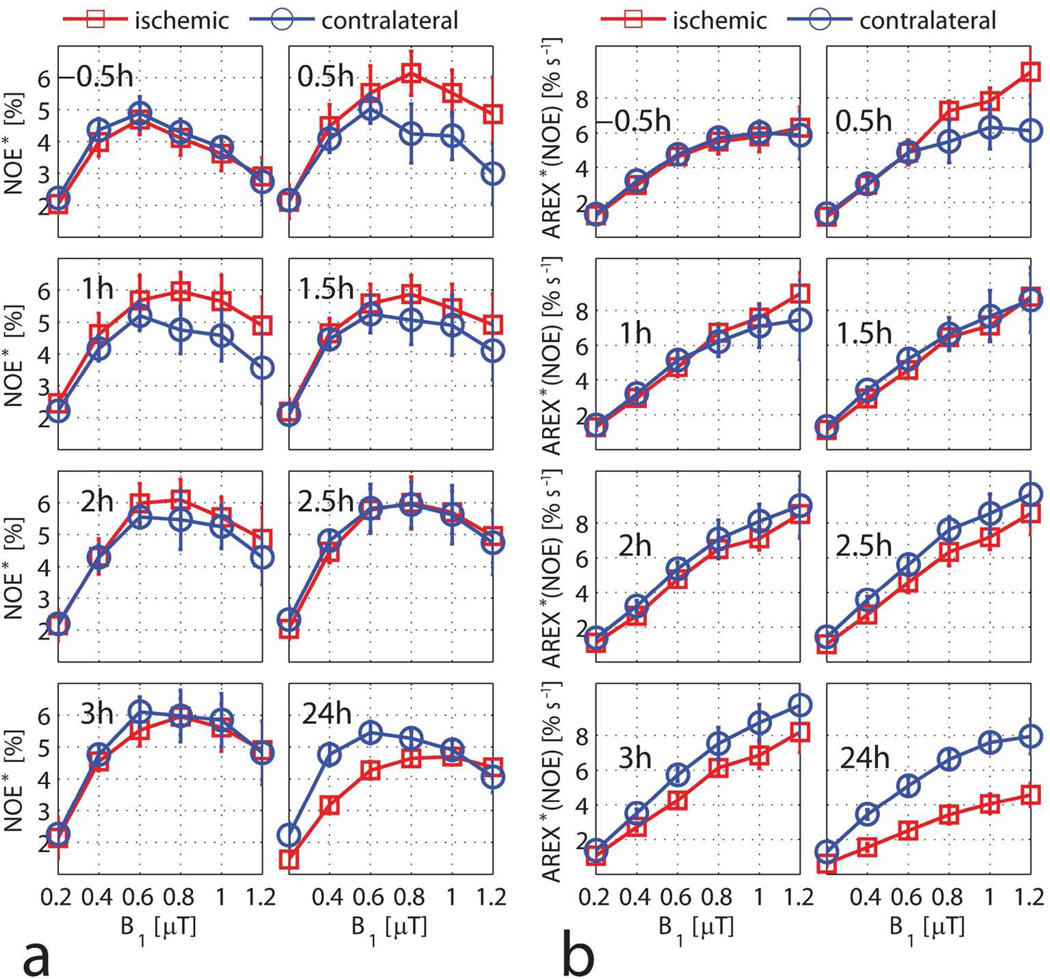
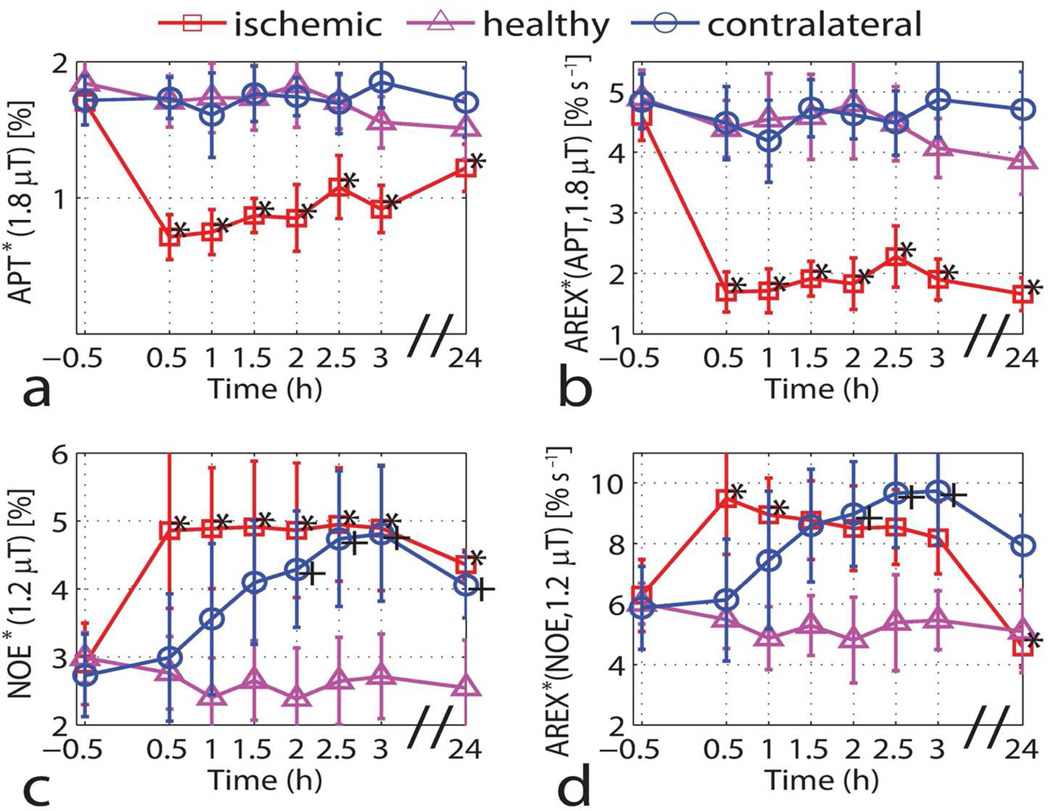
Chemical exchange saturation transfer (CEST) potentially provides the ability to detect small solute pools through indirect measurements of attenuated water signals. However, CEST effects may be diluted by various competing effects, such as non-specific magnetization transfer (MT) and asymmetric MT effects, water longitudinal relaxation (T1 ) and direct water saturation (radiofrequency spillover). In the current study, CEST images were acquired in rats following ischemic stroke and analyzed by comparing the reciprocals of the CEST signals at three different saturation offsets. This combined approach corrects the above competing effects and provides a more robust signal metric sensitive specifically to the proton exchange rate constant. The corrected amide proton transfer (APT) data show greater differences between the ischemic and contralateral (non-ischemic) hemispheres. By contrast, corrected nuclear Overhauser enhancements (NOEs) around -3.5 ppm from water change over time in both hemispheres, indicating whole-brain changes that have not been reported previously. This study may help us to better understand the contrast mechanisms of APT and NOE imaging in ischemic stroke, and may also establish a framework for future stroke measurements using CEST imaging with spillover, MT and T1 corrections.
Keywords: amide proton transfer (APT); apparent exchange-dependent relaxation (AREX); chemical exchange saturation transfer (CEST); ischemia; nuclear Overhauser enhancement (NOE); stroke.
Copyright © 2014 John Wiley & Sons, Ltd.
Figures
References
-
- Ward KM, Aletras AH, Balaban RS. A new class of contrast agents for MRI based on proton chemical exchange dependent saturation transfer (CEST) J. Magn. Reson. 2000;143(1):79–87. - PubMed
-
- Zhou J, Payen JF, Wilson DA, Traystman RJ, van Zijl PC. Using the amide proton signals of intracellular proteins and peptides to detect pH effects in MRI. Nat. Med. 2003;9(8):1085–1090. - PubMed
-
- Jokivarsi KT, Grohn HI, Grohn OH, Kauppinen RA. Proton transfer ratio, lactate, and intracellular pH in acute cerebral ischemia. Magn. Reson. Med. 2007;57(4):647–653. - PubMed
-
- Jones CK, Schlosser MJ, van Zijl PC, Pomper MG, Golay X, Zhou J. Amide proton transfer imaging of human brain tumors at 3T. Magn. Reson. Med. 2006;56(3):585–592. - PubMed
Publication types
MeSH terms
Substances
Grants and funding
- R01CA109106/CA/NCI NIH HHS/United States
- R01EB000214/EB/NIBIB NIH HHS/United States
- P50 CA128323/CA/NCI NIH HHS/United States
- R01 EB000214/EB/NIBIB NIH HHS/United States
- R01 EB017767/EB/NIBIB NIH HHS/United States
- R01 CA109106/CA/NCI NIH HHS/United States
- R21EB017873/EB/NIBIB NIH HHS/United States
- R01 CA173593/CA/NCI NIH HHS/United States
- P50CA128323/CA/NCI NIH HHS/United States
- K25 CA168936/CA/NCI NIH HHS/United States
- R01EB017767/EB/NIBIB NIH HHS/United States
- R21 EB017873/EB/NIBIB NIH HHS/United States
- R01CA184693/CA/NCI NIH HHS/United States
- K25CA168936/CA/NCI NIH HHS/United States
- R01CA173593/CA/NCI NIH HHS/United States
- R01 CA184693/CA/NCI NIH HHS/United States
LinkOut - more resources
Full Text Sources
Other Literature Sources
Medical
