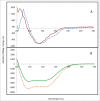
Raman spectroscopy characterization of antibody phases in serum
- PMID: 25484036
- PMCID: PMC4622053
- DOI: 10.4161/19420862.2014.975100
Raman spectroscopy characterization of antibody phases in serum
Abstract
When administered in serum, an efficacious therapeutic antibody should be homogeneous to minimize immune reactions or injection site irritation during administration. Monoclonal antibody (mAb) phase separation is one type of inhomogeneity observed in serum, and thus screening potential phase separation of mAbs in serum could guide lead optimization. However, serum contains numerous components, making it difficult to resolve mAb/serum mixtures at a scale amenable to analysis in a discovery setting. To address these challenges, a miniaturized assay was developed that combined confocal microscopy with Raman spectroscopy. The method was examined using CNTO607, a poorly-soluble anti-interleukin-13 human mAb, and CNTO3930, a soluble anti-respiratory syncytial virus humanized mAb. When CNTO607 was diluted into serum above 4.5 mg/mL, phase separation occurred, resulting in droplet formation. Raman spectra of droplet phases in mixtures included bands at 1240 and 1670 cm(-1), which are typical of mAb β-sheets, and lacked bands at 1270 and 1655 cm(-1), which are typical of α-helices. The continuous phases included bands at 1270 and 1655 cm(-1) and lacked those at 1240 and 1670 cm(-1). Therefore, CNTO607 appeared to be sequestered within the droplets, while albumin and other α-helix-forming serum proteins remained within the continuous phases. In contrast, CNTO3930 formed only one phase, and its Raman spectra contained bands at 1240, 1670, 1270 and 1655 cm,(-1) demonstrating homogeneous distribution of components. Our results indicate that this plate-based method utilizing confocal Raman spectroscopy to probe liquid-liquid phases in mAb/serum mixtures can provide a screen for phase separation of mAb candidates in a discovery setting.
Keywords: HC-CDR, heavy chain complementarity-determining region; PBS, phosphate-buffered saline; Raman spectroscopy; circular dichroism; confocal microscopy; droplets; inhomogeneity; mAb, monoclonal antibody; miniature; monoclonal antibody; phase separation; serum; α-helix, alpha helix;CD, circular dichroism; β-sheet, beta-sheet.
Figures


References
-
- Chames P, Van Regenmortel M, Weiss E, Baty D. Therapeutic antibodies: successes, limitations and hopes for the future. Br J Pharmacol 2009; 157(2):220-33; PMID:19459844; http://dx.doi.org/ 10.1111/j.1476-5381.2009.00190.x - DOI - PMC - PubMed
-
- Nelson AL, Dhimolea E, Reichert JM. Development trends for human monoclonal antibody therapeutics. Nat Rev Drug Disc 2010; 9(10):767-74; PMID:20811384; http://dx.doi.org/ 10.1038/nrd3229 - DOI - PubMed
-
- Lawrence S. Pipelines turn to biotech. Nat Biotechnol 2007; 25(12):1342; PMID:18066015; http://dx.doi.org/ 10.1038/nbt1207-1342 - DOI - PubMed
-
- Smith SL. Ten years of Orthoclone OKT3 (muromonab-CD3): a review. J Transpl Coord 1996; 6(3):109-19; PMID:9188368 - PubMed
-
- Van Wauwe JP, De Mey JR, Goossens JG. OKT3: a monoclonal anti-human T lymphocyte antibody with potent mitogenic properties. J Immunology 1980; 124(6):2708-13 - PubMed
MeSH terms
Substances
LinkOut - more resources
Full Text Sources
Other Literature Sources
