. 2015;11(1):46-59.
doi: 10.4161/15548627.2014.984271.

Metformin alleviates hepatosteatosis by restoring SIRT1-mediated autophagy induction via an AMP-activated protein kinase-independent pathway

Affiliations

Metformin alleviates hepatosteatosis by restoring SIRT1-mediated autophagy induction via an AMP-activated protein kinase-independent pathway

Young Mi Song et al. Autophagy. 2015.

Abstract

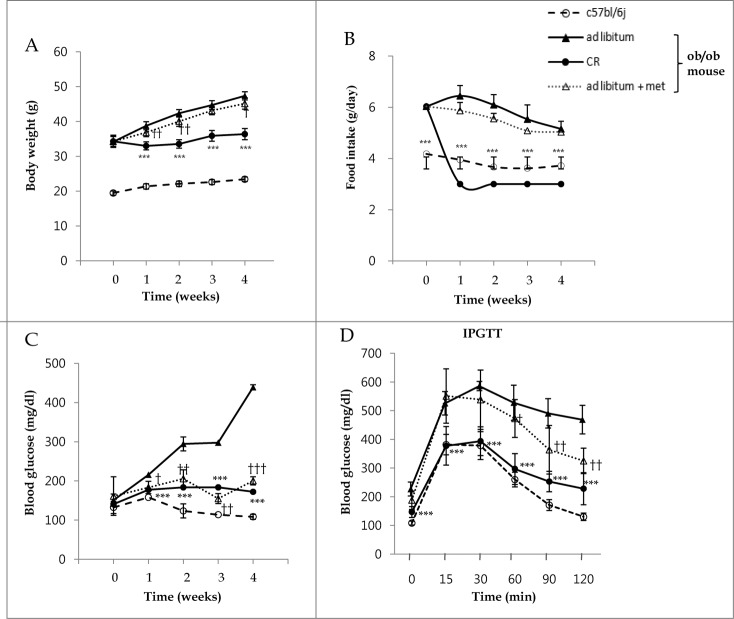
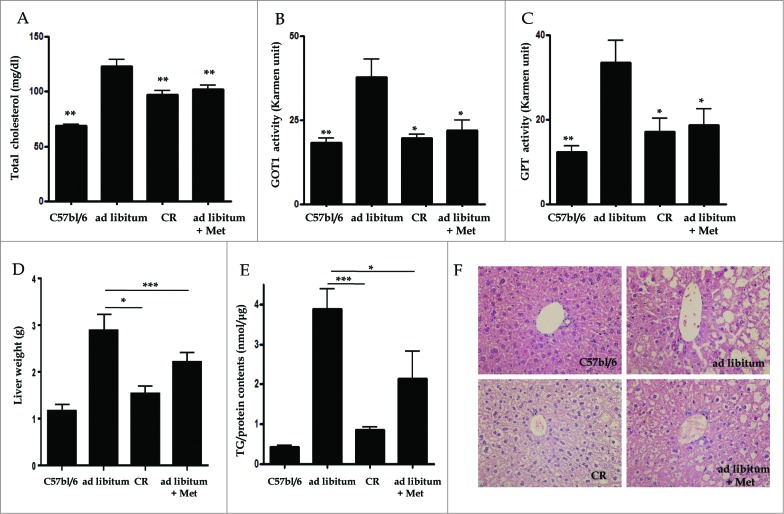
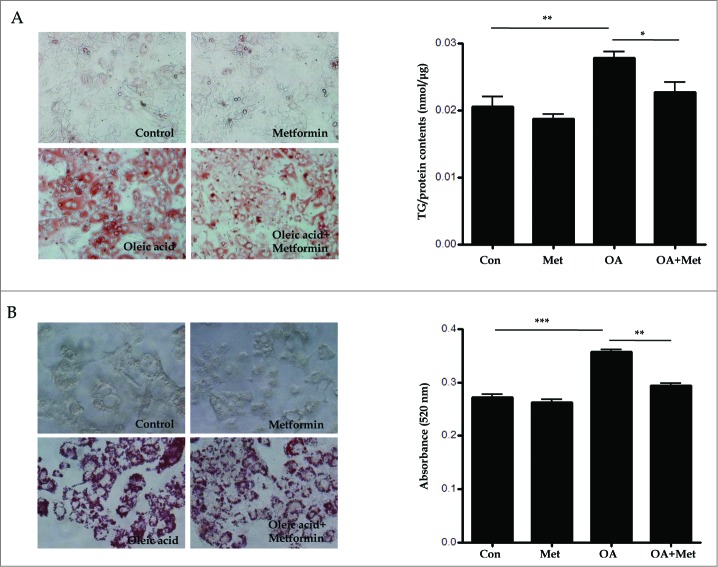
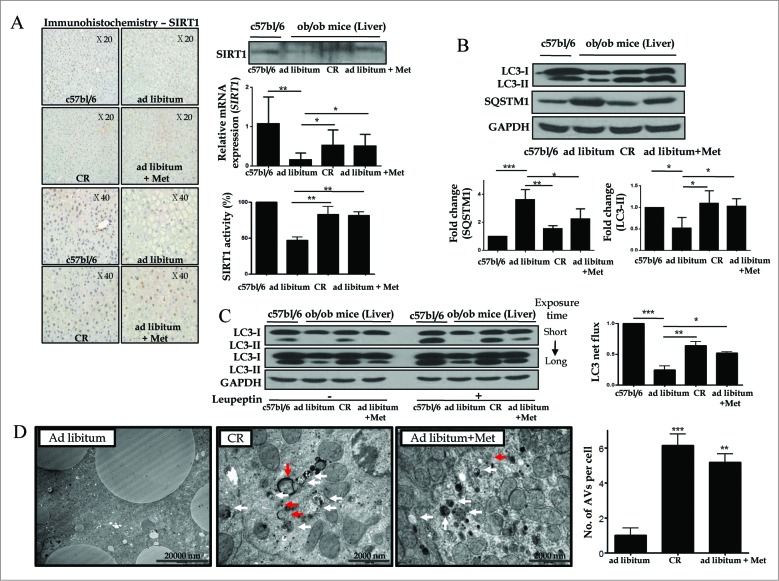
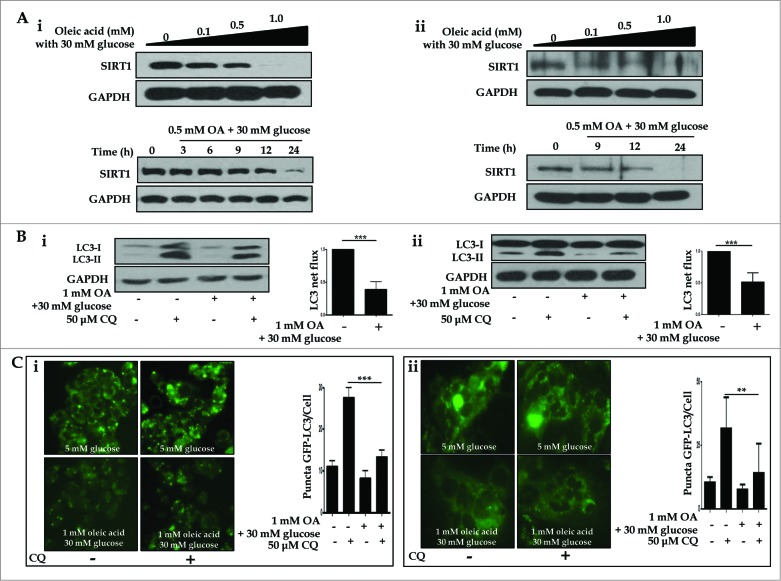
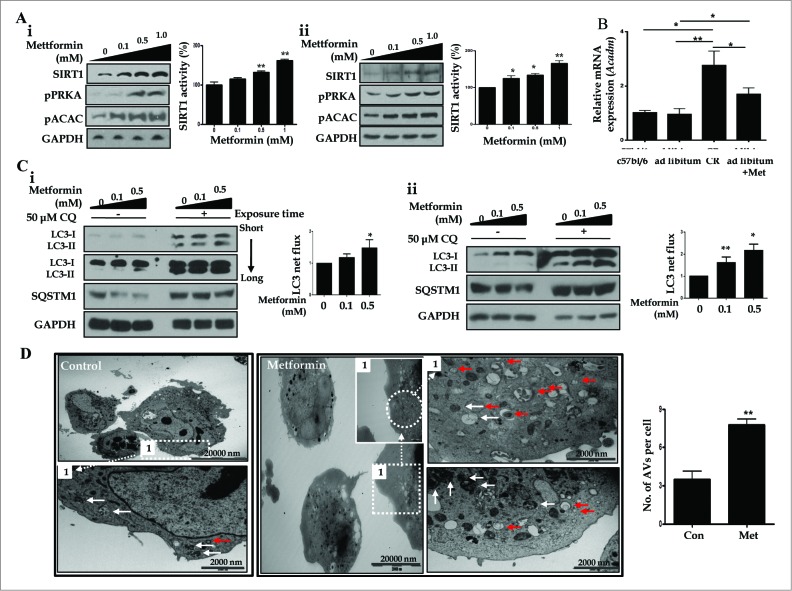
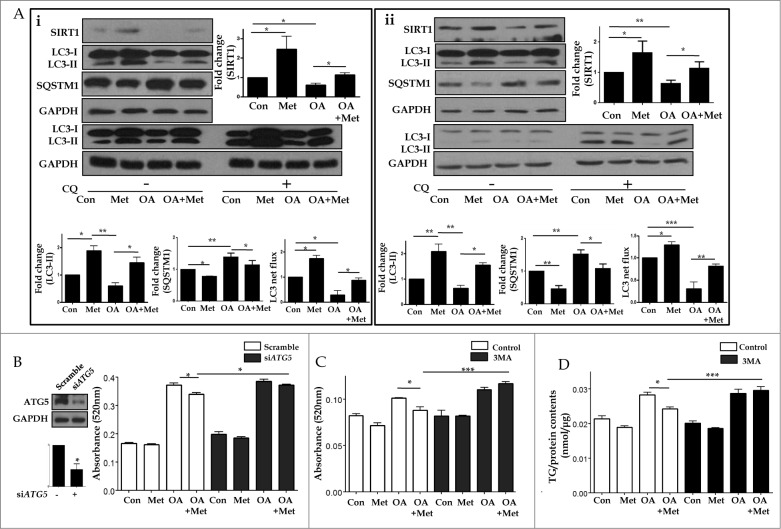
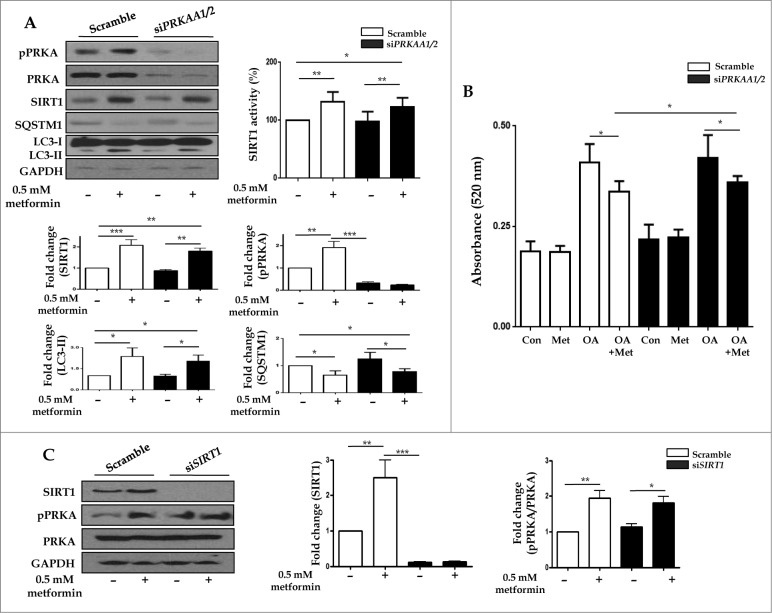
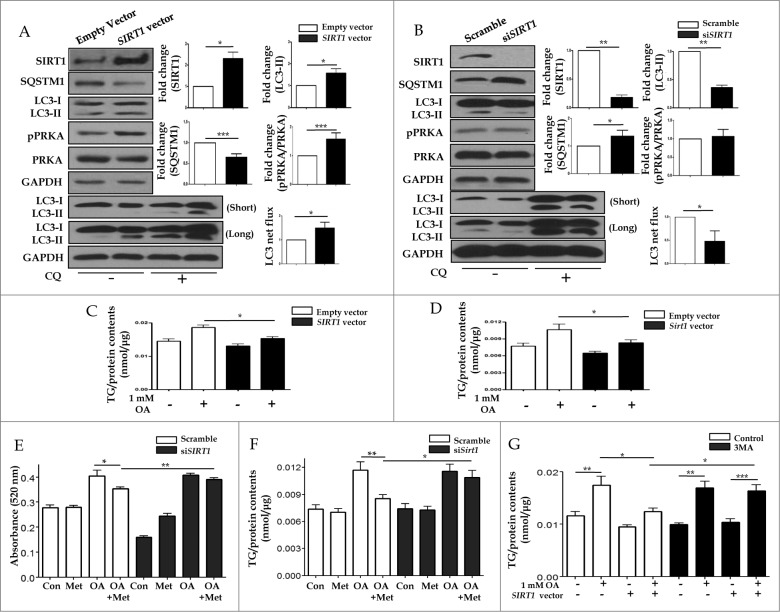
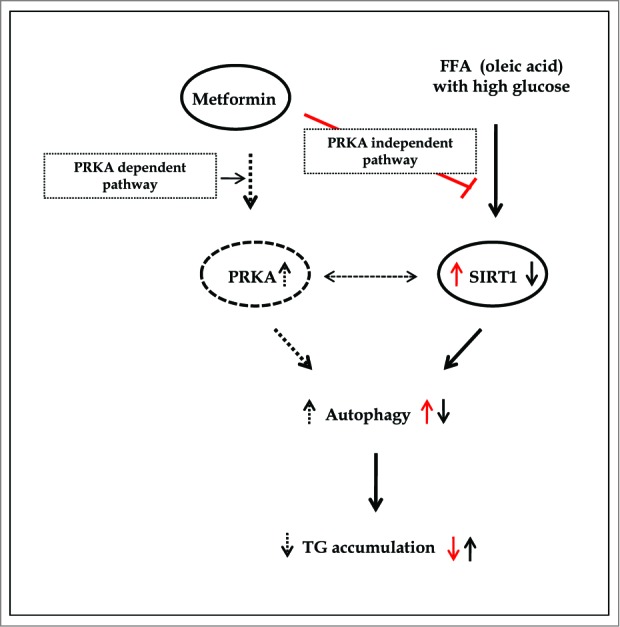
Metformin activates both PRKA and SIRT1. Furthermore, autophagy is induced by either the PRKA-MTOR-ULK1 or SIRT1-FOXO signaling pathways. We aimed to elucidate the mechanism by which metformin alleviates hepatosteatosis by examining the molecular interplay between SIRT1, PRKA, and autophagy. ob/ob mice were divided into 3 groups: one with ad libitum feeding of a standard chow diet, one with 300 mg/kg intraperitoneal metformin injections, and one with 3 g/d caloric restriction (CR) for a period of 4 wk. Primary hepatocytes or HepG2 cells were treated with oleic acid (OA) plus high glucose in the absence or presence of metformin. Both CR and metformin significantly improved body weight and glucose homeostasis, along with hepatic steatosis, in ob/ob mice. Furthermore, CR and metformin both upregulated SIRT1 expression and also stimulated autophagy induction and flux in vivo. Metformin also prevented OA with high glucose-induced suppression of both SIRT1 expression and SIRT1-dependent activation of autophagy machinery, thereby alleviating intracellular lipid accumulation in vitro. Interestingly, metformin treatment upregulated SIRT1 expression and activated PRKA even after siRNA-mediated knockdown of PRKAA1/2 and SIRT1, respectively. Taken together, these results suggest that metformin alleviates hepatic steatosis through PRKA-independent, SIRT1-mediated effects on the autophagy machinery.

Keywords: 3MA, 3-methyladenine; CQ, chloroquine; CR, caloric restriction; GOT1/AST, glutamic-oxaloacetic transaminase 1, soluble; GPT/ALT, glutamic-pyruvate transaminase (alanine aminotransferase); IPGTTs, intraperitoneal glucose tolerance tests; MTOR, mechanistic target of rapamycin; Met, metformin; NAFLD, nonalcoholic fatty liver disease; OA, oleic acid; ORO, Oil Red O; PRKA; PRKA, protein kinase, AMP-activated; SIRT1; SIRT1, sirtuin 1; T-CHO, total cholesterol; TG, triglyceride; autophagy; hepatoseatosis; metformin; siRNA, short interfering RNA.


Figures

Figure 1.
Figure 1.
Metabolic effects of metformin and caloric restriction on ob/ob mice. The effects of metformin and CR on body weight (A), food intake (B), and blood glucose (C) in the 8-wk-old C57bl/6j control (○) and ob/ob mice were evaluated. The latter mice were classified into 3 groups: ad libitum feeding of chow diets (▴), 300 mg/kg intraperitoneal metformin (▵), and 3 g/d CR (Ø). During a 4-wk treatment course of either metformin or CR, body weight significantly decreased compared to ad libitum-fed ob/ob mice (A). Due to the protocol of this study, food intake was only reduced in calorie-restricted mice. Blood glucose levels were significantly decreased throughout the entire 4 wk in ob/ob mice treated either with metformin or CR, compared to ad libitum-fed ob/ob mice (C). At 3 wk, glucose tolerance tests were performed after an intraperitoneal injection of glucose (2 g/g body weight, D). Blood was collected from the tail vein, and glucose concentrations were measured at 0, 15, 30, 60, 90, and 120 min. CR significantly improved glucose tolerance throughout the IPGTTs, but metformin only significantly improved glucose tolerance at 60, 90, and 120 min. Values displayed are means ± SEM of 8 mice per group.***P < 0.001, CR vs. ad libitum-fed ob/ob mice;`P < 0.05,††P < 0.01, and†††P < 0.001, metformin vs. ad libitum-fed ob/ob mice.
Figure 2.
Figure 2.
Hepatic effects of metformin and caloric restriction on ob/ob mice. Serum chemistry values (A-C), as well as TG contents and hepatic histology (D-F), were evaluated after 4 wk of metformin administration or CR. Levels of T-CHO, as well as GOT1 and GPT activity, were significantly decreased in ob/ob mice treated with metformin or CR compared to ad libitum-fed ob/ob mice (A-C). Mice treated with either metformin or CR also showed a significant decrease both in liver weights adjusted by body weights (D) and also in hepatic fat accumulation (E) compared to ad libitum-fed ob/ob mice. Staining of liver sections with H&E (× 40) revealed extensive macrovesicular steatosis around the perisinusoidal area in ad libitum-fed ob/ob mice (F). Values displayed are means ± SEM of 8 mice per group. Asterisks (*P < 0.05,**P < 0.01,***P < 0.001) indicate significant differences compared to ad libitum-fed ob/ob mice.
Figure 3.
Figure 3.
Metformin reduces oleic acid-induced lipid accumulation in hepatocytes in vitro. Treatment with OA (2.0 mM for primary hepatocytes, 1.0 mM for HepG2 cells) in combination with 30 mM glucose for 8 h significantly increased intracellular lipid accumulation. In contrast, pretreatment with 0.5 mM metformin for 2 h before OA exposure significantly reduced OA-induced lipid accumulation in both primary hepatocytes (A) and HepG2 cells (B), as assessed by visualization and quantification of ORO staining (× 40). Values displayed are means ± SEM of 8 independent experiments. Asterisks (*P < 0.05,**P < 0.01,***P < 0.001) indicate significant differences.
Figure 4.
Figure 4.
SIRT1 expression and autophagy induction are decreased in ob/ob mice. Immunoblots, SIRT1 activity assay, and real-time PCR and immunohistochemistry for SIRT1 were performed in mice liver tissues (A). Hepatic expression and activity of SIRT1 and induction of autophagy were significantly decreased in ad libitum-fed ob/ob mice, compared to C57bl/6j control mice. Furthermore, a 4-wk treatment course of either metformin or CR significantly restored the expression and activity of SIRT1 and induction of autophagy in ob/ob mice. Expression of LC3 and SQSTM1 was shown as a densitometric graph of the optical density-based data of immunoblots (B). LC3 immunoblots were conducted in liver tissues from 4 experimental groups to analyze autophagy flux in vivo using a leupeptin-based assay (C). Autophagy flux was expressed as the subtraction of the amount of LC3-II in the absence of leupeptin from the amount of LC3-II in the presence of leupeptin for each of the conditions, which is defined as “LC3 net flux” and graphically displayed (C, right graph). Autophagosomes (red arrows) and autolysosomes (white arrows) were shown in the electron microscopy images from ad libitum-fed ob/ob mice and ob/ob mice treated with CR or metformin (D). Scale bars are indicated. The numbers of autophagic vacuoles (autophagosomes and autolysosomes) per cell (n = 20) were counted and graphically displayed (D, right graph). Values displayed are means ± SEM of at least 5 independent experiments. Asterisks (*P < 0.05,**P < 0.01 and***P < 0.001) indicate significant differences.
Figure 5.
Figure 5.
Oleic acid downregulates hepatic expression of SIRT1 and suppresses autophagy machinery. HepG2 cells and primary hepatocytes exposed to OA in combination with 30 mM glucose exhibited decreased levels of SIRT1, as assessed by immunoblots, in a dose- (0, 0.1, 0.5 and 1.0 mM OA) and time- (0, 3, 6, 9, 12, and 24 h) dependent manner (Ai and Aii designated as HepG2 cells and primary hepatocytes, respectively). Furthermore, treatment with the lysosomal inhibitor CQ (50 μM) in combination with 1.0 mM OA and 30 mM glucose decreased LC3-II conversion, whereas CQ alone upregulated LC3-II levels in LC3 immunoblot flux assays (Bi and Bii). Autophagy flux was expressed as the subtraction of the amount of LC3-II in the absence of CQ from the amount of LC3-II in the presence of CQ for each of the conditions, which is defined as “LC3 net flux” and graphically displayed. Fluorescence confocal microscopy was used to monitor the vesicle formation step of autophagy and autophagosome-lysosome fusion in the absence or presence of 50 μM CQ (Ci and Cii). The number of GFP-LC3 puncta was quantified and plotted. Punctate patterns of the autophagic marker GFP-LC3 were decreased in response to autophagic inhibition by 1.0 mM OA. Asterisks (**P < 0.01 and***P < 0.001) indicate significant differences.
Figure 6.
Figure 6.
Metformin upregulates SIRT1 and stimulates induction of autophagy. Metformin upregulated the expression and activity of SIRT1, phosphorylated PRKA (pPRKA), and phosphorylated ACAC (pACAC) in a dose-dependent manner, as shown by immunoblots from HepG2 cells and primary hepatocytes (Ai and Aii, respectively). Asterisks (*P < 0.05 and**P < 0.01) indicate significant differences compared to the no-metformin control. Real-time RT-PCR of Acadm (acyl-CoA dehydrogenase, C-4 to C-12 straight chain) expression in mouse livers (B) showed that CR and metformin treatment significantly increased the level of Acadm. In LC3 flux assays, metformin increased LC3-II expression in a dose-dependent manner (0, 0.1, and 0.5 mM), and CQ (50 μM) upregulated LC3-II conversion in HepG2 cells and primary hepatocytes, as assessed by immunoblots (Ci and Cii). Autophagy flux was expressed as the subtraction of the amount of LC3-II in the absence of CQ from the amount of LC3-II in the presence of CQ for each of the conditions, which is defined as “LC3 net flux” and graphically displayed. Expression of SQSTM1 was decreased in metformin-treated cells in a dose-dependent manner, while it increased after addition of CQ (50 μM). In transmission electron microscopy images (D), the number of autophagosomes (red arrows) and autolysosomes (white arrows) were significantly increased in primary hepatocytes treated with metformin compared with controls. Scale bars are indicated. The numbers of autophagic vacuoles (autophagosomes and autolysosomes) per cell (n = 20) were counted and graphically displayed (D, right graph).
Figure 7.
Figure 7.
Metformin reduced OA-induced lipids by autophagy induction. Metformin also inhibited OA-induced downregulation of SIRT1 expression and autophagy induction (A). HepG2 cells (Ai) and primary hepatocytes (Aii) exposed to 1.0 mM OA showed a significant decrease in SIRT1 expression and autophagy induction, whereas pretreatment with 0.5 mM metformin significantly reduced OA-induced autophagy dysfunction. Expression of indicated proteins was shown as a densitometric graph of the optical density-based data of immunoblots. Furthermore, LC3 immunoblot flux assays showed that treatment with the lysosomal inhibitor CQ (50 μM) in combination with 1.0 mM OA alone decreased LC3-II conversion, whereas treatment with 0.5 mM metformin in the presence of CQ increased LC3-II expression in both HepG2 cells and primary hepatocytes regardless of OA. Autophagy flux was expressed as the subtraction of the amount of LC3-II in the absence of CQ from the amount of LC3-II in the presence of CQ for each of the conditions, which is defined as “LC3 net flux” and graphically displayed. Lipid accumulation was determined by fat quantification in the presence or absence of the autophagic inhibitor 3MA, and also after siRNA-mediated knockdown of ATG5. OA-treated primary mouse hepatocytes and HepG2 cells exhibited a significant increase in lipid accumulation. However, treatment with 0.5 mM metformin significantly decreased the OA-induced intracellular lipid accumulation (B-D). Furthermore, the lipid contents of both HepG2 cells transfected with siRNA against ATG5 (B) and HepG2 cells (C) or primary hepatocytes (D) treated with 5 mM 3MA in the presence of metformin and OA were similar to those of cells treated with OA alone. Values displayed are means ± SEM of 5 independent experiments. Asterisks (*P < 0.05,**P < 0.01 and***P < 0.001) indicate significant differences.
Figure 8.
Figure 8.
Metformin upregulates SIRT1 expression through a PRKA-independent pathway. HepG2 cells were transfected with siRNA against PRKAA1/2 or a scrambled siRNA control. Densitometric graphs of the optical density-based data of immunoblots (A) showed that SIRT1 expression and activity were significantly upregulated after metformin treatment in HepG2 cells regardless of PRKA expression levels. Metformin also decreased SQSTM1 expression while it increased LC3-II levels in both control and PRKAA1/2 siRNA-treated cells. Oil Red O staining and spectrophotometer analysis of HepG2 cells transfected with either siRNA against PRKAA1/2 or scrambled siRNA control demonstrated that metformin significantly decreased lipid accumulation in cells treated with OA (B). HepG2 cells were then transfected with siRNA against SIRT1, and a scrambled siRNA control, showing that the ratio of pPRKA and PRKA expression was increased upon treatment with metformin regardless of SIRT1 levels (C). Values displayed are means ± SEM of 3 to 6 independent experiments. Asterisks (*P < 0.05,**P < 0.01 and***P < 0.001) indicate significant differences.
Figure 9.
Figure 9.
SIRT1 attenuates lipid accumulation in hepatocytes through SIRT1-mediated induction of autophagy. Increased protein levels of SIRT1 in HepG2 cells transfected with a SIRT1 vector increased LC3-II conversion, while decreased expression of SQSTM1 was verified by immunoblots (A). Expression ratio of pPRKA/PRKA was also increased in SIRT1 overexpression cells. Furthermore, transfection with siRNA against SIRT1 decreased both SIRT1 protein levels and also conversion of LC3-I to LC3-II (B). Expression of SQSTM1 was significantly increased, while pPRKA levels were not affected. To investigate whether SIRT1 could regulate lipid accumulation in hepatocytes, either a SIRT1 overexpression vector or siRNA directed against SIRT1 were transfected into HepG2 cells and primary mouse hepatocytes. In HepG2 cells (C) and primary hepatocytes (D), OA-induced increases in intracellular TG contents were significantly reduced by SIRT1 overexpression. In accordance with the data presented in Figure 6D, OA-induced intracellular lipid accumulation was significantly alleviated by metformin treatment of control siRNA-treated HepG2 cells (E) and primary hepatocytes (F). In contrast, reduction of lipid contents by metformin was negligible in SIRT1-knockdown cells. Lipid accumulation was also examined in the presence or absence of the autophagic inhibitor 3MA (G). OA-treated HepG2 cells exhibited a significant increase in lipid accumulation. However, SIRT1 overexpression significantly decreased OA-induced intracellular lipid accumulation. Lipid contents of cells treated with 5 mM 3MA and transfected with SIRT1 were similar to those of cells treated with OA alone. Values are displayed as means ± SEM of 8 mice per group. Asterisks (*P < 0.05,**P < 0.01,***P < 0.001) indicate significant differences.
Figure 10.
Figure 10.
Summary of working thesis of the study. See the text for details.

References

    1. Foretz M, Hebrard S, Leclerc J, Zarrinpashneh E, Soty M, Mithieux G, Sakamoto K, Andreelli F, Viollet B. Metformin inhibits hepatic gluconeogenesis in mice independently of the LKB1AMPK pathway via a decrease in hepatic energy state. J Clin Invest 2010; 120:2355-69; PMID:20577053; http://dx.doi.org/10.1172/JCI40671 - DOI - PMC - PubMed
    1. Park HK. Metformin and cancer in type 2 diabetes. Diabetes Metab J 2013; 37:113-6; PMID:23641351; http://dx.doi.org/10.4093/dmj.2013.37.2.113 - DOI - PMC - PubMed
    1. Salminen A, Kaarniranta K. AMP-activated protein kinase (AMPK) controls the aging process via an integrated signaling network. Ageing Res Rev 2012; 11:230-41; PMID:22186033; http://dx.doi.org/10.1016/j.arr.2011.12.005 - DOI - PubMed
    1. Pallauf K, Rimbach G. Autophagy, polyphenols and healthy ageing. Ageing Res Rev 2013; 12:237-52; PMID:22504405; http://dx.doi.org/10.1016/j.arr.2012.03.008 - DOI - PubMed
    1. Caton PW, Nayuni NK, Kieswich J, Khan NQ, Yaqoob MM, Corder R. Metformin suppresses hepatic gluconeogenesis through induction of SIRT1 and GCN5. J Endocrinol 2010; 205:97-106; PMID:20093281; http://dx.doi.org/10.1677/JOE-09-0345 - DOI - PubMed

Publication types

MeSH terms

LinkOut - more resources