. 2015;11(2):298-313.
doi: 10.4161/15548627.2014.978221.

Autophagy facilitates secretion and protects against degeneration of the Harderian gland

Affiliations

Autophagy facilitates secretion and protects against degeneration of the Harderian gland

Ulrich Koenig et al. Autophagy. 2015.

Abstract

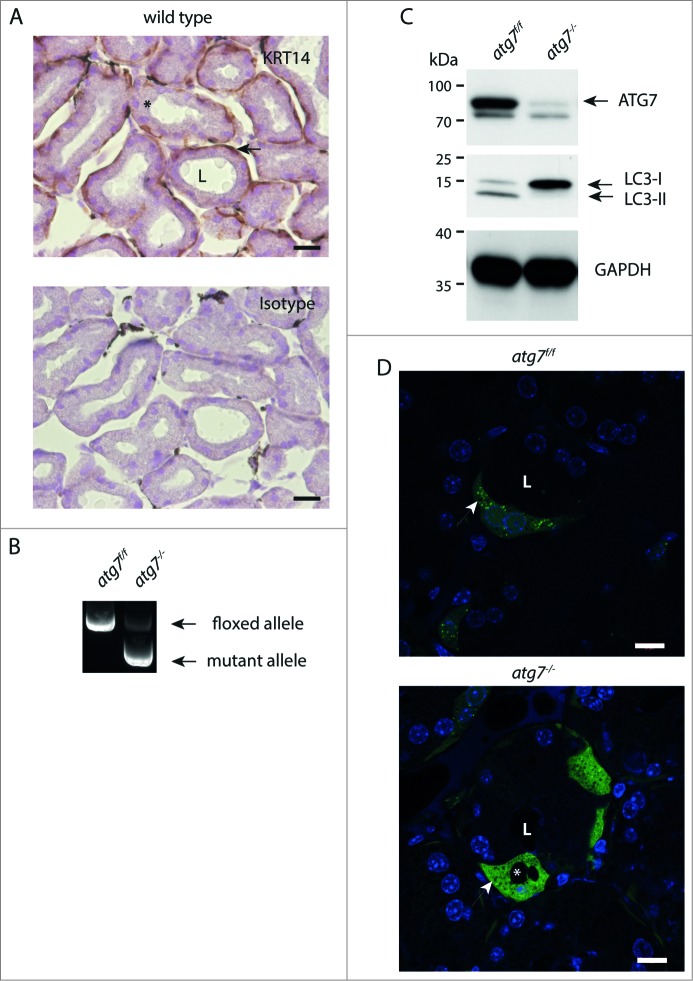
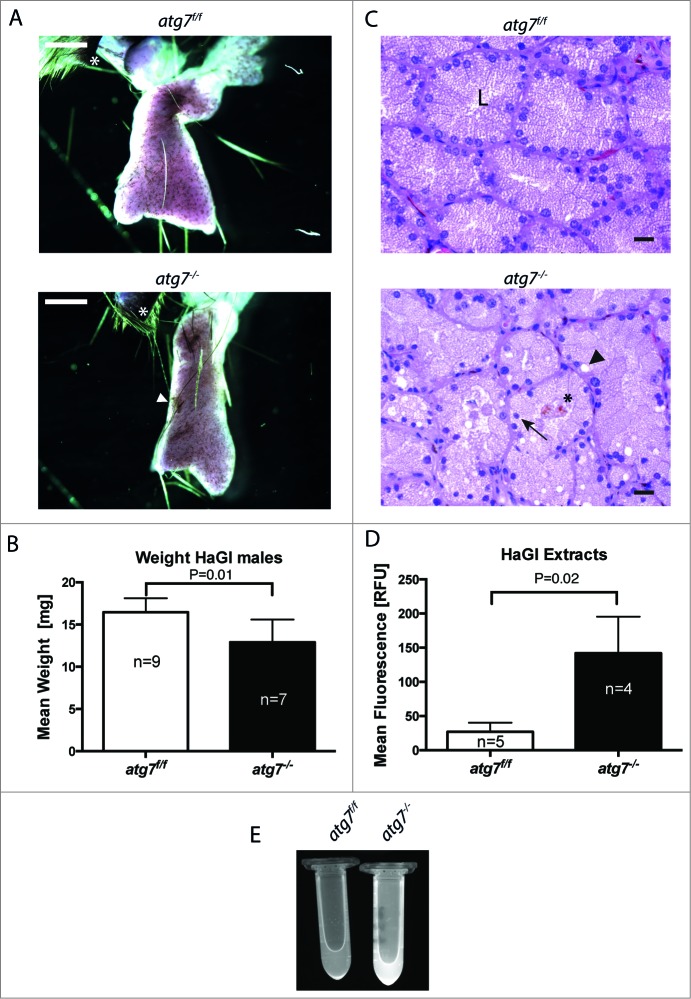
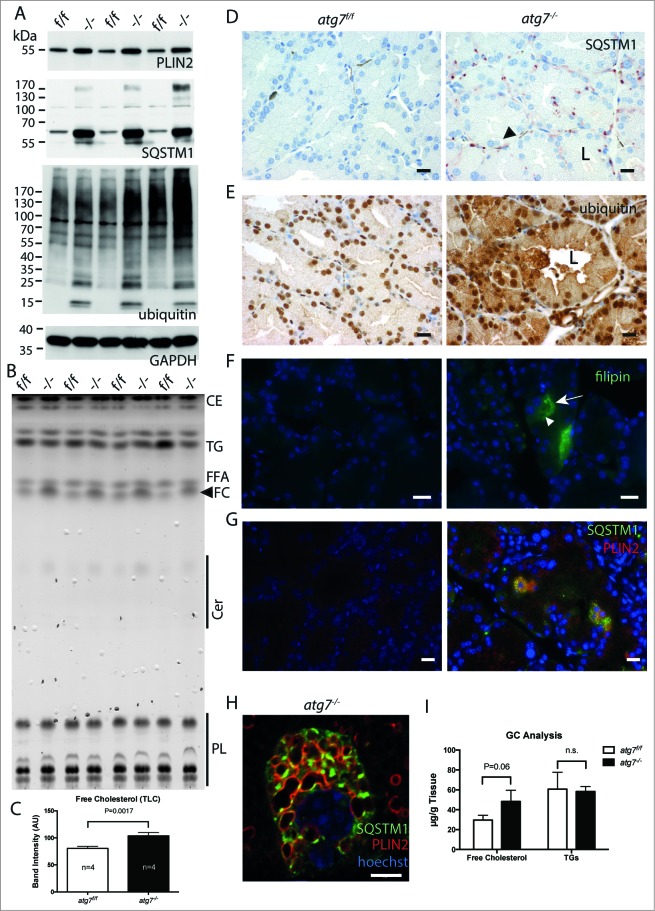
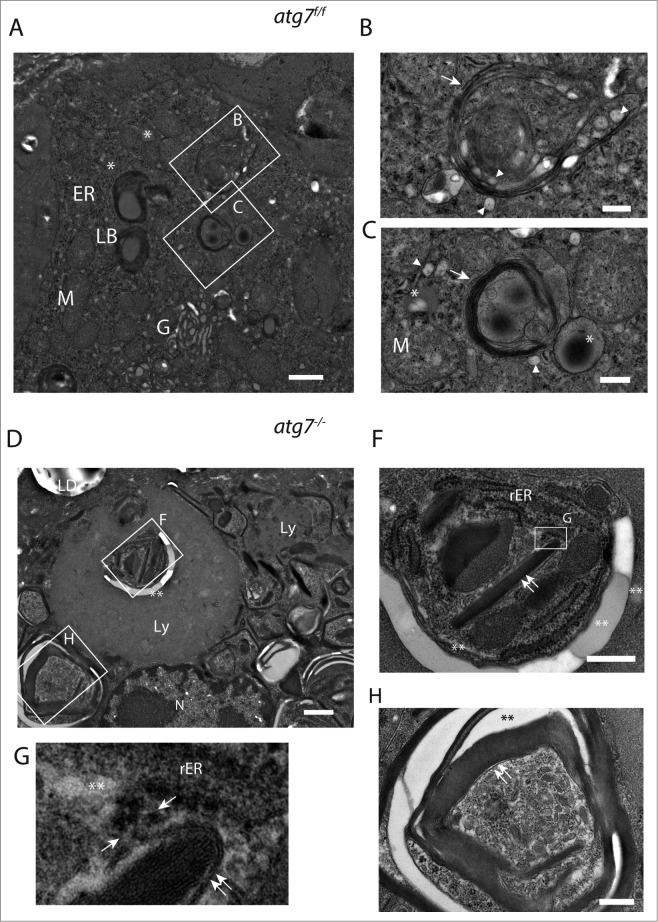
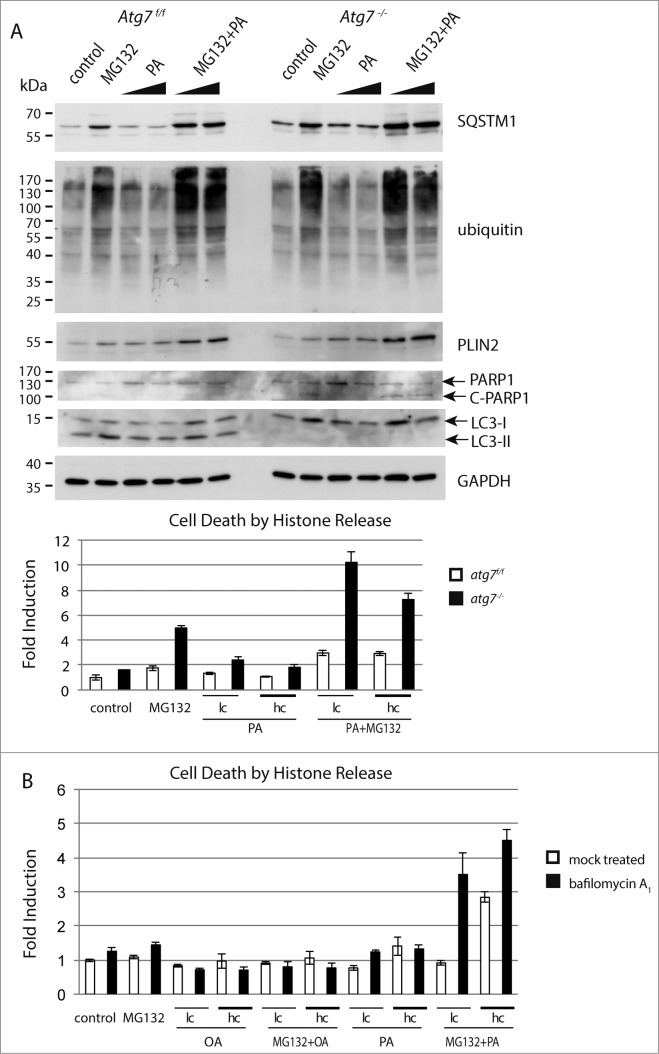
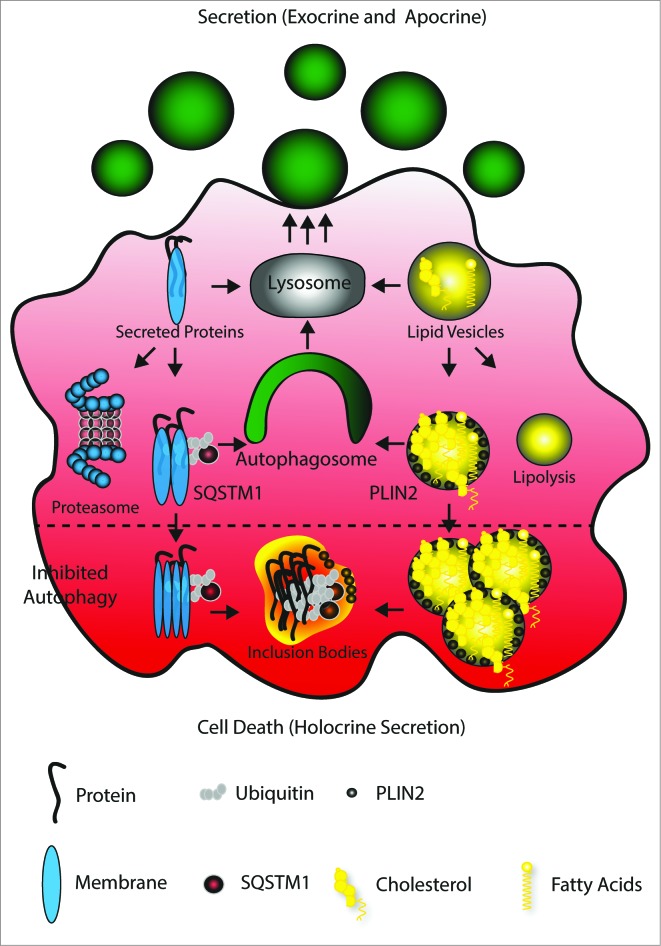
The epithelial derived Harderian gland consists of 2 types of secretory cells. The more numerous type A cells are responsible for the secretion of lipid droplets, while type B cells produce dark granules of multilamellar bodies. The process of autophagy is constitutively active in the Harderian gland, as confirmed by our analysis of LC3 processing in GFP-LC3 transgenic mice. This process is compromised by epithelial deletion of Atg7. Morphologically, the Atg7 mutant glands are hypotrophic and degenerated, with highly vacuolated cells and pyknotic nuclei. The mutant glands accumulate lipid droplets coated with PLIN2 (perilipin 2) and contain deposits of cholesterol, ubiquitinated proteins, SQSTM1/p62 (sequestosome 1) positive aggregates and other metabolic products such as porphyrin. Immunofluorescence stainings show that distinct cells strongly aggregate both proteins and lipids. Electron microscopy of the Harderian glands reveals that its organized structure is compromised, and the presence of large intracellular lipid droplets and heterologous aggregates. We attribute the occurrence of large vacuoles to a malfunction in the formation of multilamellar bodies found in the less abundant type B Harderian gland cells. This defect causes the formation of large tertiary lysosomes of heterologous content and is accompanied by the generation of tight lamellar stacks of endoplasmic reticulum in a pseudo-crystalline form. To test the hypothesis that lipid and protein accumulation is the cause for the degeneration in autophagy-deficient Harderian glands, epithelial cells were treated with a combination of the proteasome inhibitor and free fatty acids, to induce aggregation of misfolded proteins and lipid accumulation, respectively. The results show that lipid accumulation indeed enhanced the toxicity of misfolded proteins and that this was even more pronounced in autophagy-deficient cells. Thus, we conclude autophagy controls protein and lipid catabolism and anabolism to facilitate bulk production of secretory vesicles of the Harderian gland.

Keywords: Atg12, autophagy related 12; Atg7, autophagy related 7; BCA, bicinchoninic acid assay; BODIPY, boron-dipyrromethene fluorescent dye; BSA, bovine serum albumin; Cre, Cre recombinase; DMSO, dimethyl sulfoxide; ELISA, enzyme-linked immunosorbent assay; ER, edoplasmic reticulum; FC, free cholesterol; GFP, green fluorescent protein; HaGl, Harderian gland; Harderian gland; KLICK, keratosis lineariz with ichthyosis congenita and sclerosing keratoderma; KRT14, Keratin 14; LD, Lipid drops; LSM, laser scanning microscope; MAP1LC3A/B (LC3), microtubule-associated protein 1 light chain 3 α/β; MG132; MG312, synthetic peptide Z-Leu-Leu-Leu-al; ORO, oil red O; PARP, poly (ADP-ribose) polymerase; PCR, polymerase chain reaction; PLIN2, perilipin 2; RFU, relative fluorecent units; SQSTM1, sequestosome 1/p62; SQSTM1/p62; TBS-T, Tris buffered saline with Tween 20; TLC, thin layer chromatography; UV, ultraviolet; aggregates; aggresome; autophagy; cholesterol; degenerative diseases; f, floxed; keratinocytes; lipotoxicity; lysosome; multilamellar bodies; palmitate; perilipin 2/adipophilin; proteasome inhibitor.


Figures

Figure 1.
Figure 1.
Characterization of autophagy-deficient atg7−/− HaGls. (A) KRT14 expression in myoepithelial cells of the HaGl visualized by immunohistochemistry against KRT14 in young mice (3-wk-old). These basal layer cells in the ducts are formed by myoepithelial cells, which are mitotically active. Ductal cells with large and round nuclei form the inner surface of the ductal lumen. The lumen is partially filled with an amorphous substance from these secretory cells. Myoepithelial cell (→), secretory cell (*), ductal lumen (L). Size bar = 20 μm. (B) Genotyping PCR showing loss of floxed allele in HaGls of Atg7f/f Krt14-cre (atg7−/−) mice. (C) Immunoblot for ATG7, LC3 and GAPDH on Atg7f/f and atg7−/− HaGl tissue homogenates showing almost complete absence of ATG7 (upper band, lower band represents unspecific signal) and of the processed LC3-II form of LC3-I. The lack of the LC3-II band in atg7−/− samples demonstrates abrogation of autophagy. Note: The presence of residual ATG7 protein likely results from other cell types present in the HaGl, such as blood cells. (D) Sections of GFP-LC3 transgenic Atg7f/f and atg7−/− mice showing the presence of a discrete number of ductal cells that display GFP puncta reminiscent of autophagosomes in Atg7f/f. Note: The cell in the center of the Atg7f/f section is binucleated, a feature of the HaGl. In contrast, and in agreement with the increase in LC3-I in the atg7−/− background, GFP-LC3 is diffusely distributed and accumulates in these samples, indicative of free form of GFP-LC3 not incorporated into autophagic vesicles. Note: a few GFP spots can still be detected in atg7−/− cells possibly resulting from GFP aggregates. *, vacuoles completely excluding GFP; arrow, small spots also excluding GFP found in both genotypes; L, ductal lumen. Nuclei were visualized with Hoechst. Size bar = 10 μm.
Figure 2.
Figure 2.
Pathology of autophagy-deficient HaGls. (A) Appearance of carmine red stained whole mount HaGl. Two to 3 lobes are visible with needle shaped pigmented deposits originating from crystalline porphyrin. The preparations contain part of the eyelid (*) for orientation. The atg7−/− glands appear smaller and contain numerous areas of accumulated crystalline porphyrin. White arrowhead corresponds to crystalline pigmented deposits. Size bars = 1 mm. (B) Bar graph quantifying organ weight revealing reduced weight of atg7−/− glands compared to Atg7f/f controls. P = 0.013. (C) Haematoxylin and eosin stained 5 μm sections of Atg7f/f and atg7−/− Harderian glands. In atg7−/− glands the following pathological characteristics were observed: loss of the organized appearance of the ducts including large vacuoles and deposits of pigmented material (porphyrin). Nuclei were often condensed or variable in size and located away from the basement toward the glandular lumen. L, glandular lumen; *, pigmented material; black arrowhead, large vacuoles; black arrow, suprabasal nucleus. Size bars = 20 μm. (D) Quantification of porphyrin levels within the HaGl under UV bright field fluorescence. Statistical analysis indicated a significantly higher fluorescence of atg7−/− extracts, P = 0.02. (E) Markedly increased porphyrin content in the atg7−/− HaGl extracts. The content of porphyrins is visualized by UV bright field fluorescence.
Figure 3 (See previous page).
Molecular phenotype of lipid and misfolded protein response. (A) Immunoblot of Harderian gland samples for the lipid droplet marker PLIN2, the protein aggregate marker SQSTM1, and ubiquitin as a marker for misfolded protein response. Consistently in the absence of autophagy, atg7−/− gland samples accumulated PLIN2, SQSTM1 protein, and SQSTM1 aggregates (higher molecular weight species of SQSTM1, which is not resolved on the SDS gel), as well as ubiquitin in comparison to the Atg7f/f control samples. (B) Determination of lipid composition by thin layer chromatography. HaGl extracts, normalized to their wet weight. Four different animals of each genotype were separated by thin layer chromatography with solvents for a broad lipid spectrum. In extracts of atg7−/− glands the amount of free cholesterol (FC) is increased. A prominent band corresponds to the triglycerides analog (TG) 1-Alkyl-2,3-diacylglycerol, which according to the literature is the most abundant class of lipids of the Harderian gland. Wax esters and cholesterol esters (CE), free fatty acids (FFA), Ceramides (Cer), polar lipids (mostly phospholipids, PL). (C) Quantification of free cholesterol from the TLC. Analysis of the band intensity showed a 30% increase in of free cholesterol compared relative to the gland weight (P = 0.0017). (D) Immunohistochemistry for the protein aggregate marker SQSTM1. While no SQSTM1 is detected in sections of the Atg7f/f control, the signals for SQSTM1 have a granular and circular appearance and were sometimes localized in a juxtanuclear position or at the base of the duct in sections of atg7−/− glands. Here the size of the SQSTM1 granule indicates large inclusions and deposits, which were found in a mosaic like pattern affecting cells unequally. In addition, SQSTM1 is weak and diffusely distributed in the cytoplasm and in the secretions within the ductal lumen. The diffuse SQSTM1 distribution may reflect a more immature state of potentially not further aggregated cellular forms of misfolded proteins. Black arrowhead corresponds to large vacuoles found in atg7−/− cells that did not stain for SQSTM1. L, ductal lumen. Size bar = 20 μm. (E) Ubiquitin accumulation in atg7−/− glands. Ubiquitinated proteins are highly abundant in the cytoplasm of atg7−/− ductal cells compared to controls. Ubiquitin staining appears partly granular indicating aggregates. Cell debris containing ubiquitin can be detected in the ductal lumen (L). Size bar = 20 μm. (F) Cholesterol aggregating cells of atg7−/− glands. Filipin III binds to diffuse and aggregated cholesterol in atg7−/− glands. Such cells highly accumulating cholesterol (white arrow) were absent in control sections. Some vacuoles exclude cholesterol (white arrowhead). Size bar = 20 μm. (G) Coimmuno-fluorescence of SQSTM1 protein aggregates and PLIN2 lipid droplets. Sections of atg7−/− HaGls reveal an overall higher abundance of PLIN2-positive lipids droplets. SQSTM1 staining is granular and diffuse. Interestingly, discrete cells accumulate both PLIN2-positive lipid droplets and SQSTM1, while this is not observed in cells of control animals. PLIN2 is stained in red, SQSTM1 in green, nuclei are stained in blue by Hoechst. Size bar 20 μm. (H) Single cell laser scanning image of a SQSTM1 and PLIN2 double-positive cell. PLIN2 staining has a circular, droplet like appearance, while SQSTM1 stains large granules and diffusely in the cytoplasmic. SQSTM1 staining is close to the droplets but does not entirely cover the PLIN2 positive structures. Largely these markers appear separate. Note that in this particular cell the nucleus is heavily deformed. PLIN2 stains in red, SQSTM1 in green, nuclear stain Hoechst in blue. Size bar = 5 μm. (I) Gas chromatographic analysis of neutral lipids of the HaGl. Free cholesterol is markedly increased in lipid extracts (n = 3, P = 0.06), whereas triglycerides and free fatty acids do not differ.
Figure 4 (See previous page).
Ultrastructure of ductal Harderian gland cell. (A) Type B HaGl cell containing multilamellar bodies (LB) with a woolly appearance in different stages of maturation. (B) Nascent lamellar body of an early stage. During the formation of these secretory vesicles, small primary lysosomes (white arrowhead) fuse with the nascent lamellar body containing a few lamellae (white arrow). (C) Nascent lamellar body of a later stage. Further lamellae (white arrow) are acquired by the incorporation of dark lipid drops (*) and the fusion of lysosomes (white arrowhead). (D) Tertiary lysosomes in atg7−/− HaGls. A tertiary lysosome (Ly) adjacent to the nucleus occupies a large area of the cytoplasm in an autophagy-deficient mouse. The content of this vacuole is not fully homogeneous, but has several pieces of membrane stacks and lipids (**). This 7-μm spanning compartment is separated from the cytoplasm by a unit membrane and has a further inclusion (E). In addition, tight lamella stacks, lipid clefts and smaller tertiary lysosomes are observed in the cytoplasm of this cell. (E) Inclusions of the tertiary lysosome. The enlarged area displays rough endoplasmic reticulum (rER), tight lamella stacks (double arrows), lipid inclusions (**) and electron dense areas potentially originating from disassembled lamellae. (F) High magnification of tight lamella stacks revealed that they are continuous with the rough endoplasmic reticulum (rER), where ribosomes are stripped off at a certain site (opposing arrows). (G) Further tight lamellar ER stacks (double arrows) with additional inclusions of rER and lipids (**). LB, multilamellar body; rER, rough endoplasmic reticulum; M, mitochondria; G, Golgi; arrowhead, primary lysosome; arrow, lamella; Ly, tertiary lysosome; LD, lipid droplet of an adjacent cell; N, nucleus; opposing arrows, demarcation line between rough endoplasmic reticulum and lamellar stacks; double arrows, tight lamella stacks; *, small electron dense/dark lipid drop; **, lipid inclusions. Size bars: 1 μm ((A)and D), 500 nm (B, C, (E)and G).
Figure 5 (See previous page).
Effect of misfolded protein stress and excess of lipids in Atg7f/f and atg7−/− keratinocytes. (A) Immunoblot of extracts from primary murine keratinocytes treated with MG132 (250 nM) or palmitate (62.5 and 125 μM) or a combination of both for 16 h. Controls were treated with DMSO and the lipid carrier bovine serum albumin. The addition of MG132 causes an accumulation of ubiquitinated proteins and the misfolded protein aggregate marker SQSTM1. The addition of palmitate causes an upregulation of the lipid droplet protein PLIN2. Both responses, the misfolded protein and lipid accumulation, are more pronounced in keratinocytes isolated from atg7−/− animals. Similarly, PARP cleavage is more pronounced in autophagy-deficient keratinocytes. Cell death was further quantified by histone ELISA in this experiment (lower panel). In all treatments atg7−/− keratinocytes are more sensitive than control cells. The strongest induction of cell death was measured when combining MG132 and palmitate. Experiments were done in triplicates. (B) Inhibition of autophagy with bafilomycin A1. C57Bl/6 derived keratinocytes were treated with or without bafilomycin A1 (50 nM), MG132 (250 nM) and/or palmitate or oleate (both 62.5 (lc) and 125 μM (hc)). The induction of cell death seen in bafilomycin A1-treated keratinocytes by palmitate or in combination of palmitate and MG132 is similar to those in atg7−/− cells. MG132 alone was a less potent inducer of cell death in this setting. The addition of oleate was tolerated by keratinocytes. Palmitate (PA), oleate (OA).
Figure 6.
Figure 6.
Model of autophagy facilitating secretion. The main mechanism of Harderian gland secretion is to directly target proteins and lipids to the lysosome (gray) to generate secretory vesicles (green, round). However, an oversupply of proteins and lipids generated by the high metabolic activity of these epithelial cells causes ubiquitination and SQSTM1 tagging of proteins and PLIN2 coating of lipid drops. These are cleared by autophagy (green) and thus targeted to the lysosome. The inhibition of autophagy (lower part) leads to aggregation, which may cause loss of cell attachment and cell death (apocrine secretion).

References

    1. Brookheart RT, Michel CI, Schaffer JE. As a matter of fat. Cell Metab 2009; 10:9-12; PMID:19583949; http://dx.doi.org/10.1016/j.cmet.2009.03.011 - DOI - PMC - PubMed
    1. Laplante M, Sabatini DM. mTOR signaling in growth control and disease. Cell 2012; 149:274-93; PMID:22500797; http://dx.doi.org/10.1016/j.cell.2012.03.017 - DOI - PMC - PubMed
    1. Ouellet J, Barral Y. Organelle segregation during mitosis: lessons from asymmetrically dividing cells. J Cell Biol 2012; 196:305-13; PMID:22312002; http://dx.doi.org/10.1083/jcb.201102078 - DOI - PMC - PubMed
    1. Lin H. Cell biology of stem cells: an enigma of asymmetry and self-renewal. J Cell Biol 2008; 180:257-60; PMID:18227277; http://dx.doi.org/10.1083/jcb.200712159 - DOI - PMC - PubMed
    1. Lippens S, Denecker G, Ovaere P, Vandenabeele P, Declercq W. Death penalty for keratinocytes: apoptosis versus cornification. Cell Death Differ 2005; 12 Suppl 2:1497-508; PMID:16247497; http://dx.doi.org/10.1038/sj.cdd.4401722 - DOI - PubMed

Substances