. 2014;10(11):1965-77.
doi: 10.4161/auto.36182.

Autophagy in osteoblasts is involved in mineralization and bone homeostasis

Affiliations

Autophagy in osteoblasts is involved in mineralization and bone homeostasis

Marie Nollet et al. Autophagy. 2014.

Abstract

Bone remodeling is a tightly controlled mechanism in which osteoblasts (OB), the cells responsible for bone formation, osteoclasts (OC), the cells specialized for bone resorption, and osteocytes, the multifunctional mechanosensing cells embedded in the bone matrix, are the main actors. Increased oxidative stress in OB, the cells producing and mineralizing bone matrix, has been associated with osteoporosis development but the role of autophagy in OB has not yet been addressed. This is the goal of the present study. We first show that the autophagic process is induced in OB during mineralization. Then, using knockdown of autophagy-essential genes and OB-specific autophagy-deficient mice, we demonstrate that autophagy deficiency reduces mineralization capacity. Moreover, our data suggest that autophagic vacuoles could be used as vehicles in OB to secrete apatite crystals. In addition, autophagy-deficient OB exhibit increased oxidative stress and secretion of the receptor activator of NFKB1 (TNFSF11/RANKL), favoring generation of OC, the cells specialized in bone resorption. In vivo, we observed a 50% reduction in trabecular bone mass in OB-specific autophagy-deficient mice. Taken together, our results show for the first time that autophagy in OB is involved both in the mineralization process and in bone homeostasis. These findings are of importance for mineralized tissues which extend from corals to vertebrates and uncover new therapeutic targets for calcified tissue-related metabolic pathologies.

Keywords: ACP5/TRAP, acid phosphatase 5, tartrate resistant; BECN1, Beclin 1, autophagy-related; BV, bone volume; Baf, bafilomycin A1; Col1A, collagen, type I, α 1; HRTEM, high resolution transmission electron microscopy; MAP1LC3 (LC3), microtubule-associated protein 1 light chain 3; OB, osteoblast; OC, osteoclast; PBS, phosphate-buffered saline; RNA, ribonucleic acid; RUNX2, runt-related transcription factor 2; SAED, selected area electron diffraction; SPP1/OPN, secreted phosphoprotein 1; TNFSF11/RANKL, tumor necrosis factor (ligand) superfamily, member 11; TUBB, tubulin, beta; TV, total volume; autophagy; bone remodeling; mineralization; osteoblast.


Figures
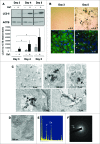
Figure 1.
Figure 1.
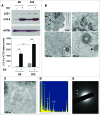
Mineralization is associated with autophagy induction in the UMR-106 osteoblastic cell line. (A) UMR-106 cells were cultured in mineralization medium and proteins were extracted at d 3, 4, and 5. Western blot of LC3 and ACTB, representative of 3 experiments. LC3-II to ACTB relative levels are presented. Means and standard errors are shown. Statistical significance was determined by the Student t test (*P < 0.05). (B) Optical and confocal microscopy analysis of GFP-LC3 expressing UMR-106 cell line at d 3 and 5 during mineralization, representative of 3 experiments. Black and white arrows indicate mineralization foci (F) and autophagic cells, respectively. (C) Electron microscopy of mineralizing UMR-106 cells. White arrows indicate autophagic vesicles. Black arrows indicate mineralization crystal-like structures. Black arrowheads point to the double membrane. The dashed line delimitates the extracellular medium. (D) High-resolution transmission electron microscopy of the crystal-like structures. (E) X-ray microanalysis indicating the components of the crystal-like structures. (F) Electron diffraction of the crystal-like structures. Arrows point to the reflections of hydroxyapatite.
Figure 2.
Figure 2.
Mineralization is associated with autophagy induction in mouse primary osteoblasts. (A) Mouse primary osteoblasts were cultured in mineralization medium and proteins were extracted at d 5 and 12. Western blot of LC3 and ACTB at d 5 and 12 during mineralization in primary mouse OB, representative of 3 experiments. LC3-II to ACTB relative levels are presented. Means and standard errors are shown. Statistical significance was determined by the Student t test (**P < 0.005). (B) Electron microscopy of mineralizing primary OB. The area included in the black square is enlarged. White arrows indicate autophagic vesicles. Black arrows indicate mineralization crystal-like structures that can be light or very dense. mtc, mitochondria; N, nucleus. (C) High-resolution transmission electron microscopy of the crystal-like structures. (D) X-ray microanalysis indicating the components of the crystal-like structures. (E) Electron diffraction of the crystal-like structures.
Figure 3.
Figure 3.
Knockdown of autophagy genes reduces mineralization capacity in the UMR-106 cell line. (A) Western blot of ATG7 and β-tubulin, 24 h after siRNA transfection in UMR-106 cells, representative of 3 experiments. siC, control siRNA; siAtg7, Atg7 siRNA. (B) Alizarin red staining of mineralization nodules, representative of 4 experiments. UMR-106 cells were transfected with siRNA and cultured in mineralization medium for 5 d. Upper panels: representative pictures of the wells; lower panels: representative pictures of mineralization foci (dark spots, x 2.5 magnification). (C) Mean number of mineralization nodules in each condition, 10 wells per condition, representative of 4 experiments. (D) Western blot of BECN1 and ACTB, 48 h after siRNA transfection in UMR-106 cells, representative of 3 experiments. siC, control siRNA; siBecn1, Becn1 siRNA. (E) Alizarin red staining of mineralization nodules, representative of 3 experiments. UMR-106 cells were transfected with siRNA and cultured in mineralization medium for 5 d. Upper panels: representative pictures of the wells; lower panels: representative pictures of mineralization foci (dark spots, x 2.5 magnification). (F) Mean number of mineralization nodules in each condition, 10 wells per condition, representative of 3 experiments.
Figure 4.
Figure 4.
Atg5 deficiency in osteoblasts results in decreased mineralization. Alizarin red staining of mineralization in calvaria bone explant cultures from control (Atg5flox-flox Col1A-Cre-, C) and mutant (atg5flox-flox Col1A-Cre+, M) mice, representative of 3 experiments. B, bone explant.
Figure 5.
Figure 5.
For figure legend, see page 1972.Figure 5 (See previous page). Atg5 deficiency in osteoblasts stimulates OC generation in calvarial explants. (A) Representative photographs of ACP5 staining in calvarial bone explants from control (Atg5flox-flox Col1A-Cre-, C) and mutant (atg5flox-flox Col1A-Cre+, M) mice, representative of 4 experiments. Cultures from mutant mice exhibit a 7-fold increase in OC number compared to cultures from control littermates (mean: 77 ± 37 in mutant vs 10 ± 8 in control cultures). Each well represents a single calvaria. B, bone explant. (B) Secreted TNFSF11 measured in the conditioned medium of calvarial bone explants from control (C) and mutant (M) mice. Each dot represents the result obtained for one calvaria (n = 5) and the line shows the median. *P < 0.05 vs respective Atg5flox-flox Col1A-Cre- by the Student t test. (C) Oxidative stress in bone explant cultures from control (C) and mutant (M) mice, 4 mice per condition. Representative photographs of both conditions and mean fluorescence intensity measured in 440 cells per condition. (D) Relative expression level of Runx2, Spp1, and Col1a mRNA in calvariae from female mutant mice compared with female control mice determined by quantitative RT-PCR. Results are presented as mean ± SD (n = 4). *P < 0.05 vs control by the Student t test.
Figure 6.
Figure 6.
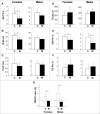
Bone mass is decreased following Atg5 deletion. (A to F) Histomorphometric analysis of 9-mo-old female and male atg5flox-flox Col1A-Cre+ mice and their control littermates. Bars indicate mean ± SD. C, Atg5flox-flox Col1A-Cre- mice, females: n = 8, males: n = 9; M, atg5flox-flox Col1A-Cre+ mice, females: n = 9, males: n = 9. (A) Percentage of bone volume per total volume (BV/TV). (B) Trabecular width (Tb.Wi). (C) Trabecular number per mm (Tb.N). (D) Trabecular spacing (Tb.Sp). (E) Percentage of trabecular bone surface covered by osteoblast (OB Pm). (F) Percentage of trabecular bone surface covered by OC (OC Pm). (G) OB to OC ratio (%) in female and male control and mutant mice. *P < 0.05 vs control by the Student t test.
Figure 7.
Figure 7.
3D reconstruction of distal femur trabecular bone using microCT. Wild-type (C) and mutant (M) female mice femurs were collected at 9 mo of age. These reconstructions based on 100 section analysis, illustrate the decrease of trabecular bone volume in atg5flox-flox Col1A-Cre+ mutant mice.

References

    1. Raggatt LJ, Partridge NC. Cellular and molecular mechanisms of bone remodeling. J Biol Chem 2010; 285:25103-8; PMID:20501658; http://dx.doi.org/10.1074/jbc.R109.041087 - DOI - PMC - PubMed
    1. Kular J, Tickner J, Chim SM, Xu J. An overview of the regulation of bone remodelling at the cellular level. Clin Biochem 2012; 45:863-73; PMID:22465238; http://dx.doi.org/10.1016/j.clinbiochem.2012.03.021 - DOI - PubMed
    1. Manolagas SC. From estrogen-centric to aging and oxidative stress: a revised perspective of the pathogenesis of osteoporosis. Endocr Rev 2010; 31:266-300; PMID:20051526; http://dx.doi.org/10.1210/er.2009-0024 - DOI - PMC - PubMed
    1. Levine B, Kroemer G. Autophagy in the pathogenesis of disease. Cell 2008; 132:27-42; PMID:18191218; http://dx.doi.org/10.1016/j.cell.2007.12.018 - DOI - PMC - PubMed
    1. Mizushima N, Levine B, Cuervo AM, Klionsky DJ. Autophagy fights disease through cellular self-digestion. Nature 2008; 451:1069-75; PMID:18305538; http://dx.doi.org/10.1038/nature06639 - DOI - PMC - PubMed

Publication types