. 2015 Apr;1850(4):794-801.
doi: 10.1016/j.bbagen.2014.11.021. Epub 2014 Dec 5.

Nrf2 regulates ROS production by mitochondria and NADPH oxidase

Affiliations

Nrf2 regulates ROS production by mitochondria and NADPH oxidase

Stjepana Kovac et al. Biochim Biophys Acta. 2015 Apr.

Abstract

Background: Nuclear factor (erythroid-derived 2) factor 2 (Nrf2) is a crucial transcription factor mediating protection against oxidants. Nrf2 is negatively regulated by cytoplasmic Kelch-like ECH associated protein 1 (Keap1) thereby providing inducible antioxidant defence. Antioxidant properties of Nrf2 are thought to be mainly exerted by stimulating transcription of antioxidant proteins, whereas its effects on ROS production within the cell are uncertain.

Methods: Live cell imaging and qPCR in brain hippocampal glio-neuronal cultures and explants slice cultures with graded expression of Nrf2, i.e. Nrf2-knockout (Nrf2-KO), wild-type (WT), and Keap1-knockdown (Keap1-KD).

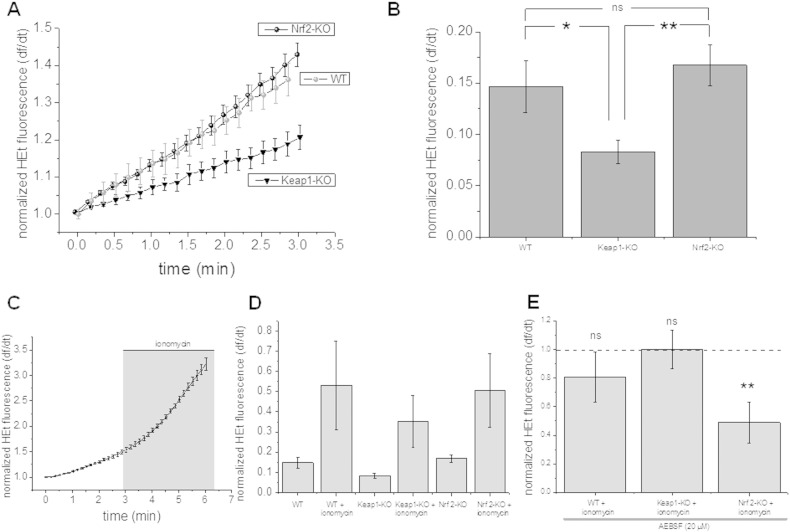
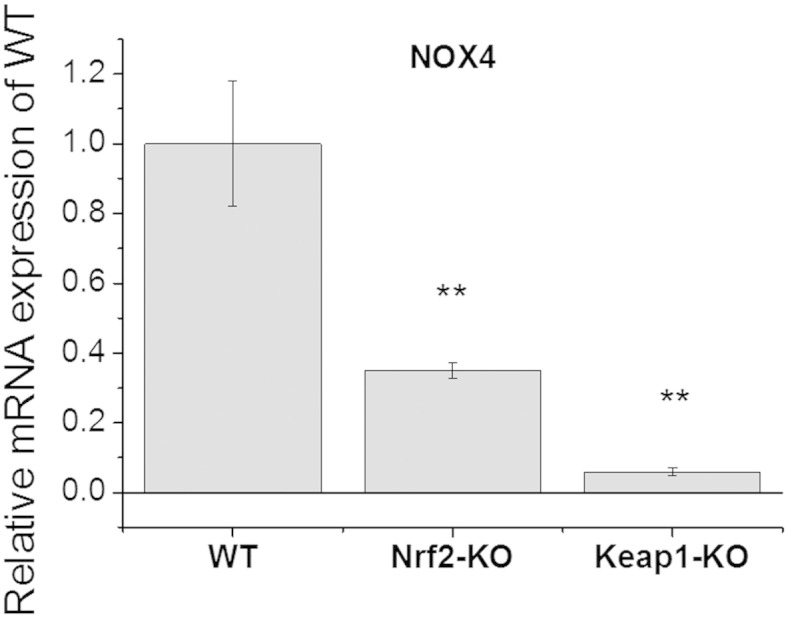
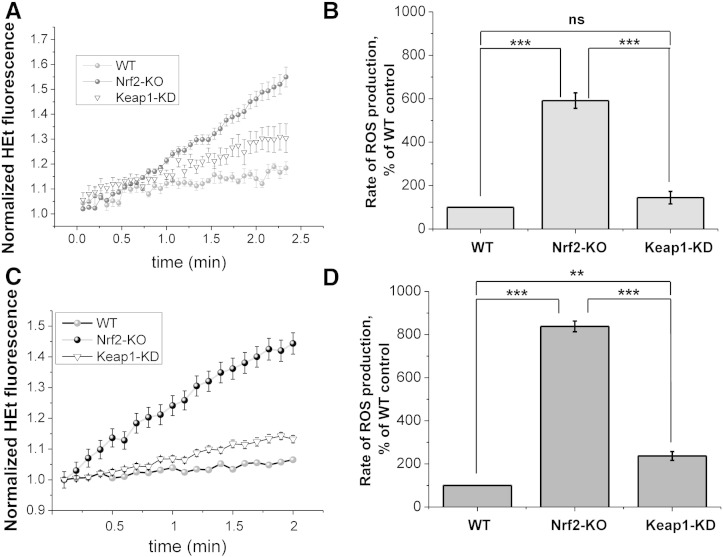
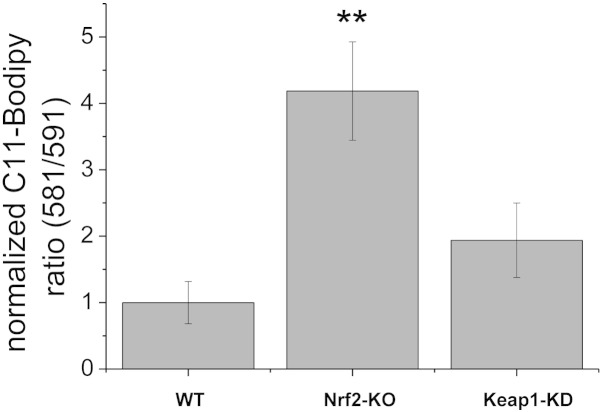
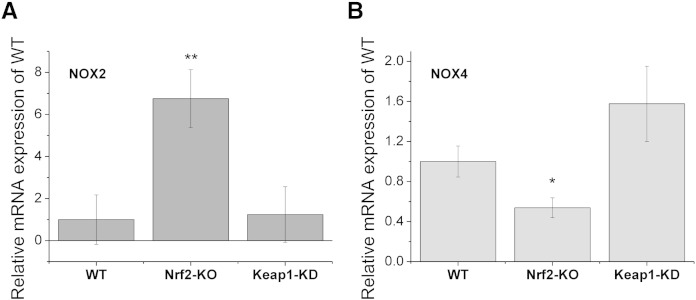
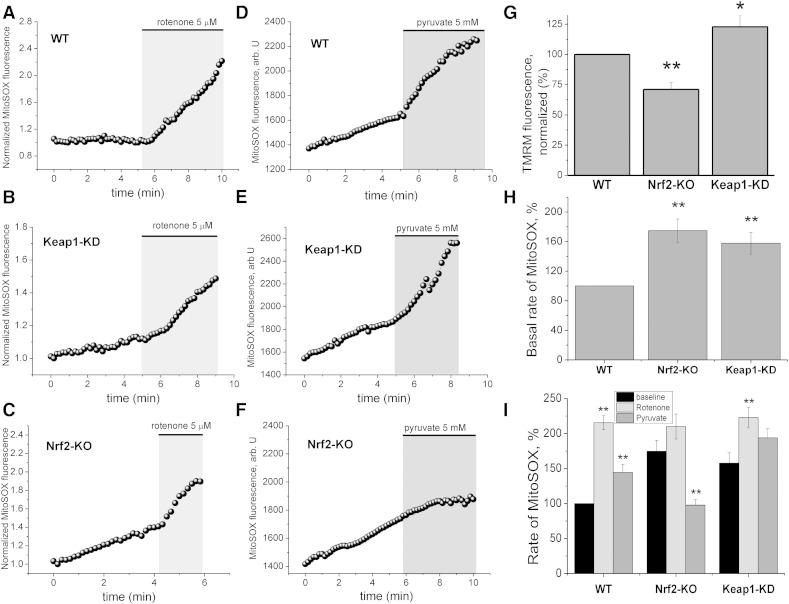
Results: We here show that ROS production in Nrf2-KO cells and tissues is increased compared to their WT counterparts. Mitochondrial ROS production is regulated by the Keap1-Nrf2 pathway by controlling mitochondrial bioenergetics. Surprisingly, Keap1-KD cells and tissues also showed higher rates of ROS production when compared to WT, although with a smaller magnitude. Analysis of the mRNA expression levels of the two NOX isoforms implicated in brain pathology showed, that NOX2 is dramatically upregulated under conditions of Nrf2 deficiency, whereas NOX4 is upregulated when Nrf2 is constitutively activated (Keap1-KD) to a degree which paralleled the increases in ROS production.

Conclusions: These observations suggest that the Keap1-Nrf2 pathway regulates both mitochondrial and cytosolic ROS production through NADPH oxidase.

General significance: Findings supports a key role of the Keap1-Nrf2 pathway in redox homeostasis within the cell.

Keywords: Keap1; NADPH oxidase; NOX; Nrf2; ROS.


Figures

Fig. 1
Fig. 1
Ionomycin induced ROS production in Nrf2-KO, Keap1-KO and wild-type (WT) mouse embryonic fibroblasts (MEFs). ROS production as measured with HEt fluorescence is significantly reduced in Keap1-KO when compared to Nrf2-KO and WT (A and B). The graphs show the mean (and SEM) rate of ROS production in a representative experiment (A). Histograms quantifying rates of ROS production in the three groups (B; each n = 7 coverslips). Treatment with ionomycin, an activator of NADPH oxidase, induced ROS production in all three genotypes (n = 7 coverslips; C and D). C: Increase of ROS production in MEFs after treatment with ionomycin as measured with HEt representative experiment (mean and SEM; n = 4 cells); histogram summarizing ROS increase after ionomycin treatment; co-treatment of MEFs with an inhibitor of NADPH oxidase, AEBSF (20 μM), during activation with ionomycin reduced the rate of ROS production when compared to ionomycin treatment only in Nrf2-KO MEFs (E). Note that inhibition of NADPH oxidase in Keap1-KO and WT MEFs activated with ionomycin did not have any effect on ROS production when compared to ionomycin treatment alone. Error bars indicate SEM. **p < 0.01; *p < 0.05.
Fig. 2
Fig. 2
mRNA expression levels of NOX4 in Nrf2-KO, Keap1-KO and wild-type (WT) MEFs. Histogram quantifying relative mRNA expression with WT mRNA set as 1 (mean ± SD); **p < 0.01; ***p < 0.001.
Fig. 3
Fig. 3
ROS production in Nrf2-KO, Keap1-KD and wild-type (WT) neuronal co-cultures and organotypic slice cultures. ROS production is significantly higher in Nrf2-KO both in glio-neuronal co-culture (A and B; WT: n = 49 cells; 3 experiments; Nrf2-KO: n = 70 cells; 3 experiments; Keap1-KD n = 51 cells; 3 experiments) and organotypic slice cultures (C and D WT: n = 72 cells; 3 experiments; Nrf2-KO: n = 62 cells; 3 experiments; Keap1-KD n = 80 cells; 3 experiments). Panel A and C show representative experiments (mean ± SEM) demonstrating increase in ROS as measured by HEt fluorescence over time for the different groups. B and D summarize normalized ROS production rates in histograms. **p < 0.01; ***p < 0.001; ns: not significant.
Fig. 4
Fig. 4
Rates of lipid peroxidation in Nrf2-KO (n = 5), Keap1-KD (n = 5) and wild-type (WT; n = 9) organotypic slice cultures.
Fig. 5
Fig. 5
mRNA expression levels of NOX2 in Nrf2-KO, Keap1-KD and wild-type (WT) glio-neuronal co-cultures. Histograms summarizing expression of NOX2 (A) and NOX4 (B) mRNA in mouse glio-neuronal co-cultures. **p < 0.01; *p < 0.05.
Fig. 6
Fig. 6
Mitochondrial ROS production in Nrf2-KO, Keap1-KD and wild-type (WT) glio-neuronal co-cultures. Mitochondrial ROS production was measured with MitoSOX. Traces A –F show mean MitoSOX fluorescence of representative experiments in Nrf2-KO (n = 42), Keap1-KD (n = 46) and WT (n = 32) neurons. Grey background indicates treatment with rotenone (5 μM; A–C; WT (n = 16); Nrf2-KO (n = 20) and Keap1-KD (n = 20) or pyruvate (5 mM; D-F WT (n = 16); Nrf2-KO (n = 22) and Keap1-KD (n = 26). Note that treatment with pyruvate decreases mitochondrial ROS production in Nrf2-KO neurons (F). Histograms summarizing basal mitochondrial membrane potential (G) and basal mitochondrial ROS production (H) in Nrf2-KO, Keap1-KD and WT neurons. The histogram in I shows rates of mitochondrial ROS production in Nrf2-KO, Keap1-KD and WT neurons after treatment with rotenone or pyruvate. Significance levels are indicated above the bars and refer to a comparison between baseline and pyruvate or rotenone. **p < 0.01; *p < 0.05.

References

    1. Baird L., Dinkova-Kostova A.T. The cytoprotective role of the Keap1–Nrf2 pathway. Arch. Toxicol. 2011;85:241–272. - PubMed
    1. Holmström K.M., Baird L., Zhang Y., Hargreaves I., Chalasani A., Land J.M., Stanyer L., Yamamoto M., Dinkova-Kostova A.T., Abramov A.Y. Nrf2 impacts cellular bioenergetics by controlling substrate availability for mitochondrial respiration. Biol. Open. 2013;2:761–770. - PMC - PubMed
    1. Ludtmann M.H.R., Angelova P.R., Zhang Y., Abramov A.Y., Dinkova-Kostova A.T. Nrf2 affects the efficiency of mitochondrial fatty acid oxidation. Biochem. J. 2014;457:415–424. - PMC - PubMed
    1. Motohashi H., Yamamoto M. Nrf2-Keap1 defines a physiologically important stress response mechanism. Trends Mol. Med. 2004;10:549–557. - PubMed
    1. Domijan A.-M., Kovac S., Abramov A.Y. Lipid peroxidation is essential for phospholipase C activity and the inositol-trisphosphate-related Ca2 + signal. J. Cell Sci. 2014;127:21–26. - PubMed

Publication types

MeSH terms

Substances