. 2014 Nov 21:8:134.
doi: 10.3389/fnana.2014.00134. eCollection 2014.

Physiological characterization of formyl peptide receptor expressing cells in the mouse vomeronasal organ

Affiliations

Physiological characterization of formyl peptide receptor expressing cells in the mouse vomeronasal organ

Tobias Ackels et al. Front Neuroanat. .

Abstract

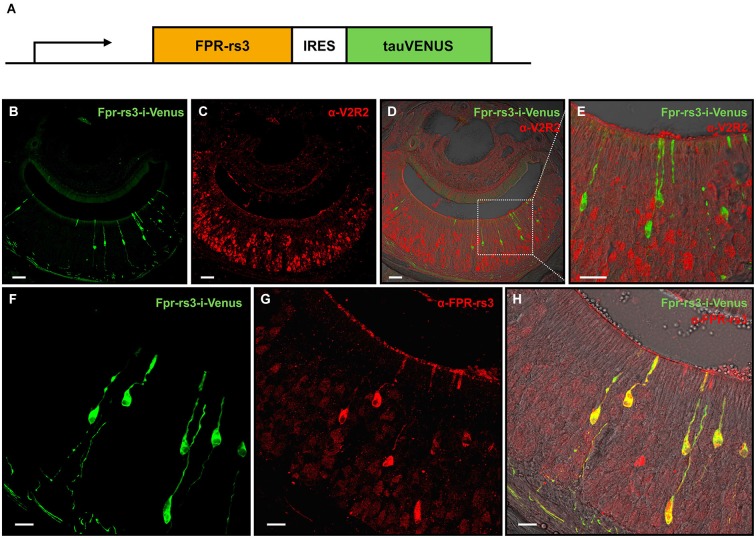
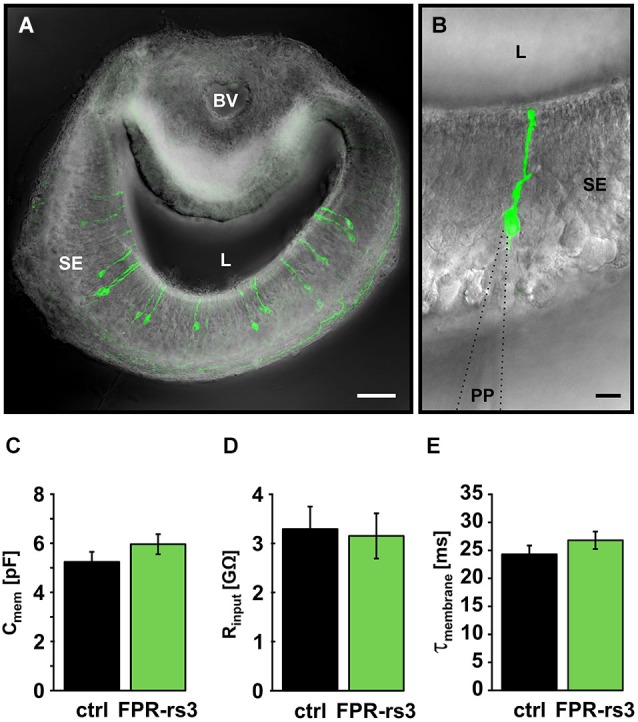
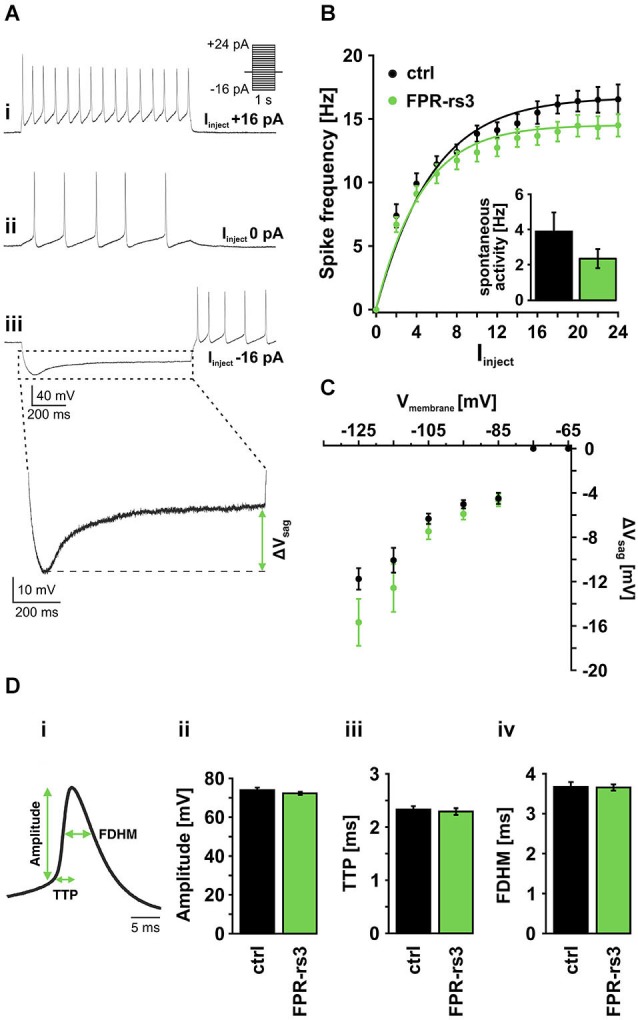
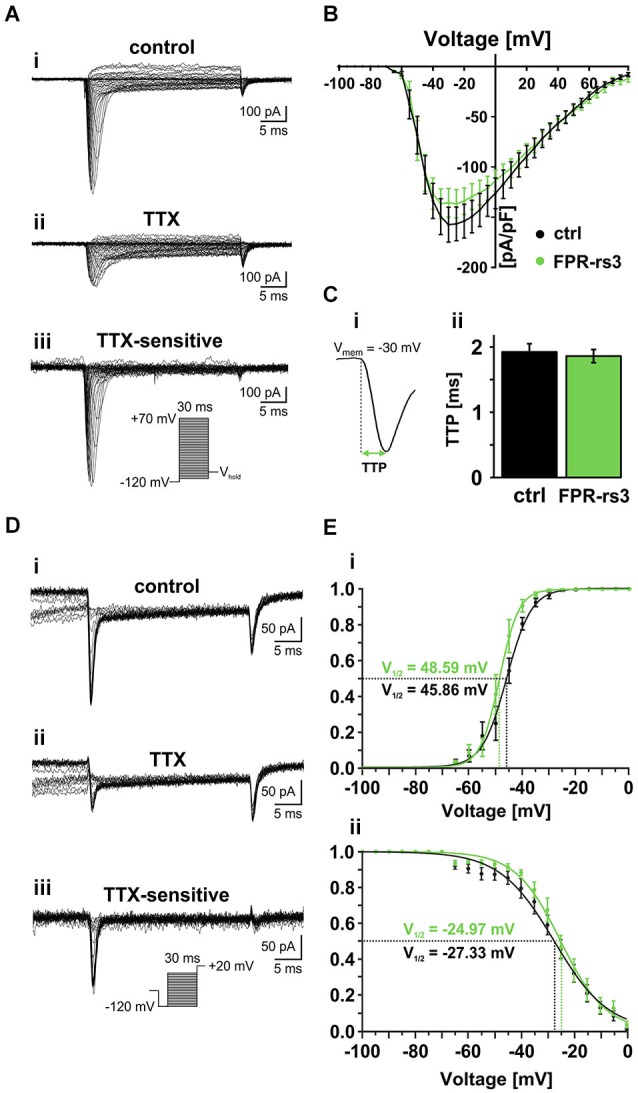
The mouse vomeronasal organ (VNO) is a chemosensory structure that detects both hetero- and conspecific social cues. Based on largely monogenic expression of either type 1 or 2 vomeronasal receptors (V1Rs/V2Rs) or members of the formyl peptide receptor (FPR) family, the vomeronasal sensory epithelium harbors at least three neuronal subpopulations. While various neurophysiological properties of both V1R- and V2R-expressing neurons have been described using genetically engineered mouse models, the basic biophysical characteristics of the more recently identified FPR-expressing vomeronasal neurons have not been studied. Here, we employ a transgenic mouse strain that coexpresses an enhanced variant of yellow fluorescent protein together with FPR-rs3 allowing to identify and analyze FPR-rs3-expressing neurons in acute VNO tissue slices. Single neuron electrophysiological recordings allow comparative characterization of the biophysical properties inherent to a prototypical member of the FPR-expressing subpopulation of VNO neurons. In this study, we provide an in-depth analysis of both passive and active membrane properties, including detailed characterization of several types of voltage-activated conductances and action potential discharge patterns, in fluorescently labeled vs. unmarked vomeronasal neurons. Our results reveal striking similarities in the basic (electro) physiological architecture of both transgene-expressing and non-expressing neurons, confirming the suitability of this genetically engineered mouse model for future studies addressing more specialized issues in vomeronasal FPR neurobiology.

Keywords: VNO; formyl peptide receptor; olfaction; sensory neurons; vomeronasal organ; vomeronasal receptor.


Figures

Figure 1
Figure 1
Generation and characterization of the Fpr-rs3-i-Venus transgenic mouse line. (A) Schematic of the transgene that includes an OR promoter/enhancer, followed by the coding sequence of FPR-rs3 and a polycistron that drives the tau-Venus fluorophore. (B) Confocal image of a coronal VNO cryosection showing sparsely distributed fluorescently labeled FPR-rs3+ VSNs (green) in the sensory neuroepithelium. (C) Confocal image displaying a coronal VNO cryosection immunostained with an antibody against V2R2 (red), a family-C V2R expressed in most basal VSNs. (D) Overlay of FPR-rs3 tau-Venus fluorescence and anti-V2R2 staining shows no co-localization of apically located FPR-rs3+ and basal V2R2 expressing neurons. (E) Higher magnification of the boxed area in (D) illustrating the absence of overlapping fluorescence. (F) Confocal image of a VNO cryosection showing distinct green fluorescent FPR-rs3+ sensory neurons (green). (G) Confocal image displaying the same area as in (F) stained against the FPR-rs3 protein (red). (H) Overlay of tau-Venus fluorescence and antibody staining against the FPR-rs3 protein. Note that all transgene-positive cells also express FPR-rs3 (yellow). Scale bars, 50 µm (B–D), 10 µm (E) and 20 µm (F–H).
Figure 2
Figure 2
Passive membrane properties of FPR-rs3+ VSNs. (A) Confocal image (maximum projection) of a 150 µm acute coronal VNO tissue slice showing the distribution of fluorescent FPR-rs3 tau-Venus+ neurons (green) in the vomeronasal sensory epithelium. Fluorescent axon bundles are visible within the basal lamina. (B) FPR-rs3 tau-Venus+ neurons exhibit a single apical dendrite ending in a knob-like structure at the luminal border. Whole cell patch-clamp recordings were performed from the VSN soma. (C) Membrane capacitance and (D) input resistance (Rinput) are similar for both control and FPR-rs3+ neurons (n = 21). (E) Membrane time constant (τmembrane) of control neurons compared to FPR-rs3+ cells shows no significant difference (n = 21). Data are mean ± SEM. Blood vessel (BV), lumen (L), patch pipette (PP), sensory epithelium (SE). Scale bars, 50 µm (A), 10 µm (B).
Figure 3
Figure 3
Active membrane properties of FPR-rs3+ VSNs. (A) Representative current clamp traces showing de- / hyperpolarization and trains of (rebound) action potentials generated upon stepwise current injection. Note the spontaneous activity measured at 0 pA current injection (Aii). Injection of negative current produces a prominent voltage “sag” most likely mediated by activation of HCN channels (Aiii). (B) Firing frequency of control (n = 21) and FPR-rs3+ (n = 19) neurons as a function of the injected current (Iinject). The gradual increase in firing rate is comparable for control and FPR-rs3+ VSNs. Inset: Spontaneous spiking frequency at 0 pA current injection. Note that f-I curves have been “background-corrected” using these values. (C) Voltage “sag” (ΔVsag, n = 3–32) as a function of the peak membrane hyperpolarization (10 mV bins). ΔVsag values of control and FPR-rs3+ neurons show no statistical difference (p > 0.01, two-tailed Student’s t-test). (D) Average spike waveform illustrating analysis parameters (amplitude, time-to-peak (TTP), full duration at half-maximum (FDHM; Di). Amplitude analysis of the first action potential for each current injection step shows no difference between control and FPR-rs3+ cells (Dii). TTP analysis reveals values in the same range for both cell populations (Diii). Spike width (FDHM) is not significantly different between control and FPR-rs3+ VSNs (Div). Data are mean ± SEM.
Figure 4
Figure 4
Voltage-gated Na+ currents. (A) Representative traces from whole-cell patch-clamp recordings of a TTX-sensitive fast activating Na+ current in FPR-rs3+ VSNs. (Ai) Voltage step recording under control conditions (extracellular solution S1; intracellular solution S9) reveals a voltage-dependent fast and transient inward current. (Aii) TTX treatment (1 μM) strongly diminishes the current. Digitally subtracted trace (control—TTX (Aiii)) reveals the TTX-sensitive voltage-gated Na+ current. (B) Current-voltage relationships of TTX-sensitive Na+ currents isolated from control and FPR-rs3+ neurons (control, n = 20; FPR-rs3+, n = 10; p > 0.01, two-tailed Student’s t-test). (C) Example of a voltage-clamp recording showing the fast activating transient inward current used for upstroke kinetics analysis (Ci). TTP of the fast activating Na+ current upon depolarization to −30 mV (control, n = 20; FPR-rs3+, n = 10; Cii). (D) Representative traces showing Na+ channel steady-state inactivation under control conditions (Di), in presence of TTX (Dii), and after digital subtraction (control—TTX (Diii)). Prepulse steps from −120 mV to 0 mV were applied to analyze inactivation (Diii, inset). (E) Normalized activation (Ei) and steady-state inactivation (Eii) curves (peak current vs. pulse / prepulse voltage). Data points were fitted using a sigmoidal Boltzmann-type equation. Membrane voltage inducing half-maximal activation and inactivation (V½) as indicated. Data are mean ± SEM.
Figure 5
Figure 5
Voltage-gated K+ currents and their role in action potential firing. (A) Voltage-activated outward K+ currents under control conditions (solution S1 including TTX (1 µM) and Cd2+ (200 µM) to isolate K+ currents). Currents were induced by stepwise depolarization and measured during steady-state. Current densities were calculated and plotted against voltage (control, n = 10; FPR-rs3+, n = 13). (B) Outward currents sensitive to 1 mM TEA (control-TEA; digital subtraction; n = 10). (C) Outward currents sensitive to 10 mM 4-AP (control/TEA-4-AP; digital subtraction; n = 10). (D) Outward currents sensitive to 25 mM TEA (control/TEA/4-AP-TEA; digital subtraction; n = 10). (E) Quantification of outward currents. Maximum current densities under control conditions (left bars; 292.5 ± 22.4 pA/pF at +85 mV, n = 10 (ctrl); 276.5 ± 31.1 pA/pF, n = 13 (FPR-rs3+)) and added drug sensitive current densities (ctrl: 90.3 ± 9.1 pA/pF (1 mM TEA), 76.8 ± 7.9 pA/pF (10 mM 4-AP), 85.7 ± 11.2 pA/pF (25 mM TEA); FPR-rs3+: 78.9 ± 10.6 pA/pF (1 mM TEA), 77.5 ± 10.5 pA/pF (10 mM 4-AP), 99.8 ± 14.6 pA/pF (25 mM TEA)). Data are mean ± SEM. (F) Representative spike waveform under control conditions (solution S1 (Extra)) and in presence of TEA (1 mM) and 4-AP (10 mM; Fi). Analysis parameters (amplitude, TTP, FDHM and spike duration) are depicted schematically. Bar graphs illustrate the quantification of discharge characteristics (Fii–v). *p < 0.01; two-way ANOVA with Tukey’s multiple comparisons test. Data are mean ± SEM, number of cells as depicted inside the bars.
Figure 6
Figure 6
Voltage-gated Ca2+ currents. (A–D) Representative Ca2+ current traces isolated either biophysically (prepulse inactivation protocol; (Ai)) or pharmacologically (nifedipine (10 μM; Bi); ω-conotoxin-GVIA (2 μM; Ci); ω-agatoxin IVA (200 nM; Di)). Step protocols as indicated. Absolute (Aii–Dii) and normalized (Aiii–Diii) peak current densities are plotted as a function of membrane depolarization. Activation curves (Aiii–Diii) are fitted according to a sigmoidal Boltzmann-type equation. Membrane voltage inducing half-maximal activation (V½) as indicated. Data are mean ± SEM; *p < 0.01, two-tailed Student’s t-test.

Similar articles

Cited by

References

    1. Adams D. R. (1992). Fine structure of the vomeronasal and septal olfactory epithelia and of glandular structures. Microsc. Res. Tech. 23, 86–97. 10.1002/jemt.1070230108 - DOI - PubMed
    1. Alexander S. P. H., Benson H. E., Faccenda E., Pawson A. J., Sharman J. L., Catterall W. A., et al. . (2013). The concise guide to pharmacology 2013/14: ion channels. Br. J. Pharmacol. 170, 1607–1651. 10.1111/bph.12447 - DOI - PMC - PubMed
    1. Amberg G. C., Koh S. D., Imaizumi Y., Ohya S., Sanders K. M. (2003). A-type potassium currents in smooth muscle. Am. J. Physiol. Cell Physiol. 284, C583–C595. 10.1152/ajpcell.00301.2002 - DOI - PubMed
    1. Barry P. H. (1994). JPCalc, a software package for calculating liquid junction potential corrections in patch-clamp, intracellular, epithelial and bilayer measurements and for correcting junction potential measurements. J. Neurosci. Methods 51, 107–116. 10.1016/0165-0270(94)90031-0 - DOI - PubMed
    1. Belluscio L., Koentges G., Axel R., Dulac C. (1999). A map of pheromone receptor activation in the mammalian brain. Cell 97, 209–220. 10.1016/s0092-8674(00)80731-x - DOI - PubMed