

Regional differences in suprathreshold intensity for bitter and umami stimuli
- PMID: 25485034
- PMCID: PMC4254731
- DOI: 10.1007/s12078-014-9166-3
Regional differences in suprathreshold intensity for bitter and umami stimuli
Abstract
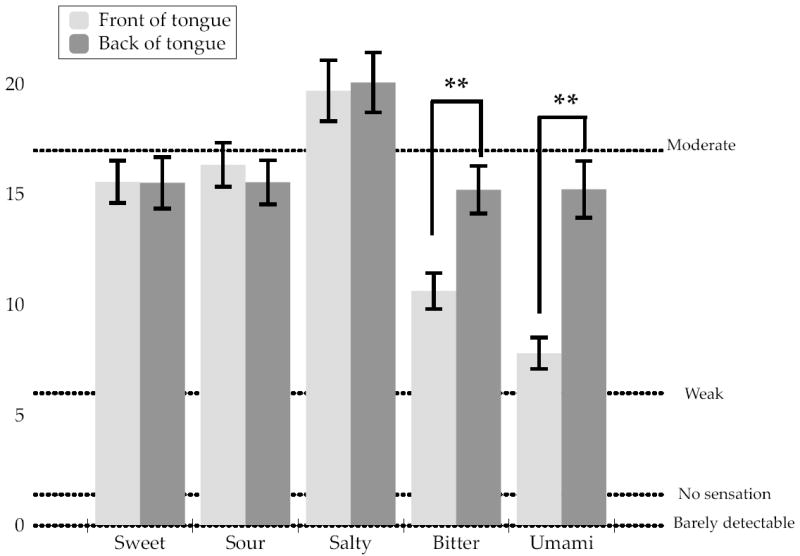
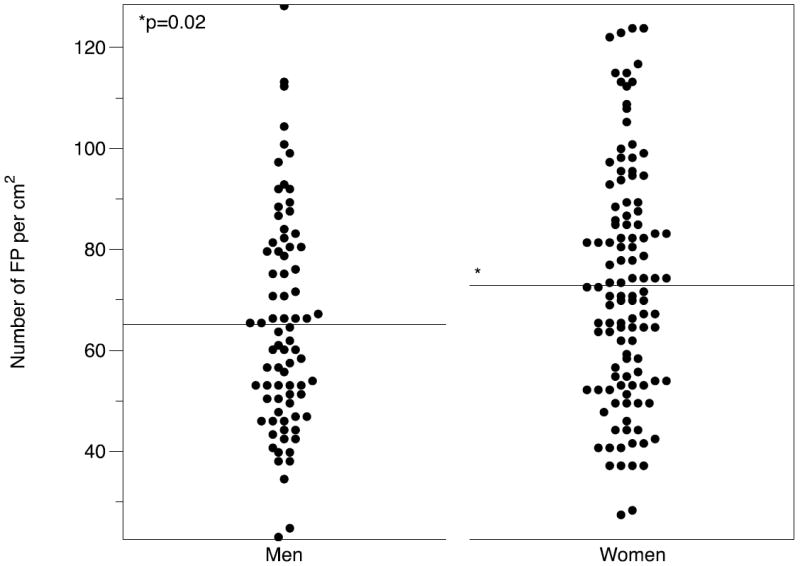
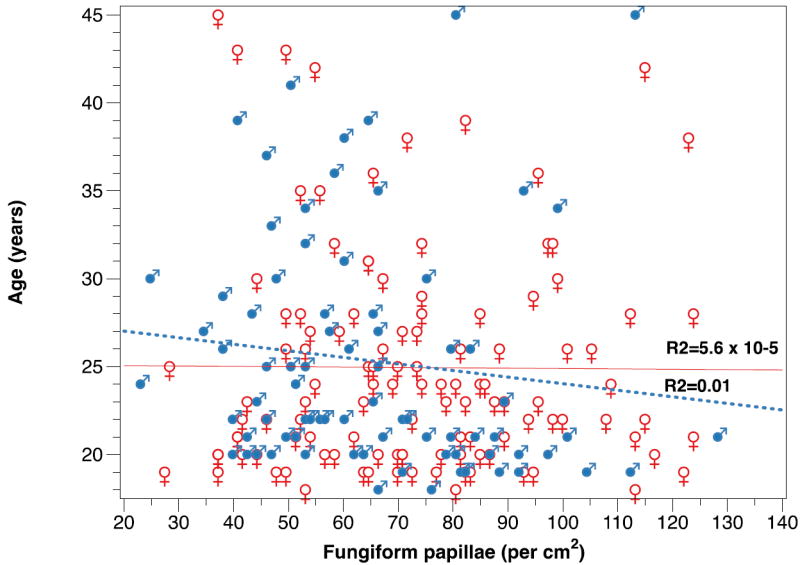
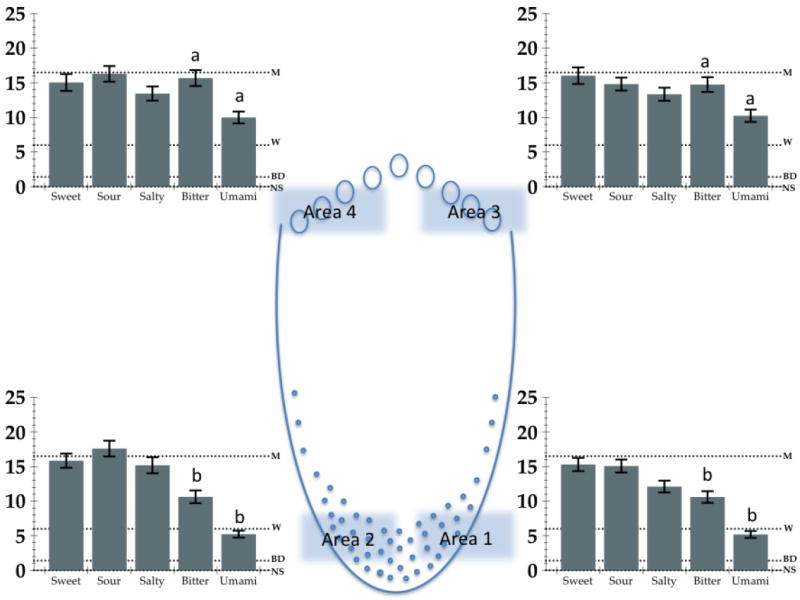
The sense of taste is often referred to as a 'nutritional gatekeeper', thought to have evolved to indicate energy sources and prevent ingestion of potential toxins. Fungiform papillae are structures on the anterior tongue in which taste buds are situated. They are concentrated at the tongue's tip and they can provide a useful estimate of overall taste bud density for taste research. Some reports suggest taste perception may differ subtly across tongue regions, irrespective of FP number. Other data show an association between taste intensity perception for the bitter compound 6-n-propylthiouracil (PROP) and FP density. However, contradictions exist in the literature, with more recent, larger studies suggesting little or no association between FP number and perceived taste intensity. Much research has examined the relation between FP density and PROP perception, while other tastes have been less thoroughly studied. Here, in a cohort of mainly Caucasian individuals, aged 18-45, recruited from the campus of a large rural university, we examined regional and whole-mouth taste intensities, and FP density using an updated method of a digital still photography method first described in 2005. We found regional differences in suprathreshold intensity. Although all taste sensations were experienced all over the tongue, once again disproving the mythical tongue map, we also observed bitter and umami taste perception to be significantly greater on the posterior tongue than on the anterior tongue. In contrast, there were no regional differences observed for sweet, salty or sour tastes. The relation of FP density to whole-mouth intensity of 6-n-propylthiouracil, and to the intensity of saltiness of NaCl, sweetness from sucrose or from Acesulfame-K, bitterness of quinine, or burning from capsaicin delivered to different regions of the tongue are also discussed.
Keywords: Fungiform papilla (FP); Project GIANT-CS; bitter; regional differences; spatial taste test; tongue map; umami.
Conflict of interest statement
Dr. Emma L. Feeney declares she has no conflict of interest. Dr. John E. Hayes has previously accepted speaking and/or consulting fees from Tate & Lyle PLC, Symrise AG, Pepisco, and General Mills, Inc. for unrelated work. He has also served on the Scientific Advisory Board of Medifast, Inc. His laboratory conducts routine taste tests for industrial clients to facilitate practical student training. None of these organizations have had any influence over study conception, design or interpretation, or the decision to publish these data.
Figures
Similar articles
-
The tongue map and the spatial modulation of taste perception.Curr Res Food Sci. 2022 Mar 18;5:598-610. doi: 10.1016/j.crfs.2022.02.004. eCollection 2022. Curr Res Food Sci. 2022. PMID: 35345819 Free PMC article. Review.
-
Association between the number of fungiform papillae on the tip of the tongue and sensory taste perception in children.Food Nutr Res. 2017 Jul 26;61(1):1348865. doi: 10.1080/16546628.2017.1348865. eCollection 2017. Food Nutr Res. 2017. PMID: 28804439 Free PMC article.
-
An automated method to detect and quantify fungiform papillae in the human tongue: Validation and relationship to phenotypical differences in taste perception.Physiol Behav. 2018 Feb 1;184:226-234. doi: 10.1016/j.physbeh.2017.12.003. Epub 2017 Dec 6. Physiol Behav. 2018. PMID: 29223711 Free PMC article.
-
Individual Variation in PROP Status, Fungiform Papillae Density, and Responsiveness to Taste Stimuli in a Large Population Sample.Chem Senses. 2018 Nov 1;43(9):697-710. doi: 10.1093/chemse/bjy058. Chem Senses. 2018. PMID: 30204849
-
How taste works: cells, receptors and gustatory perception.Cell Mol Biol Lett. 2015 Dec;20(5):699-716. doi: 10.1515/cmble-2015-0042. Cell Mol Biol Lett. 2015. PMID: 26447485 Review.
Cited by
-
The Relationships Between Common Measurements of Taste Function.Chemosens Percept. 2015;8(1):11-18. doi: 10.1007/s12078-015-9183-x. Epub 2015 Jun 5. Chemosens Percept. 2015. PMID: 26110045 Free PMC article.
-
The Interplay between Mitochondrial Metabolism and Nasal Mucociliary Function as a Surrogate Method to Diagnose Thyroid Dysfunction: Insights from a Population-Based Study.Biomedicines. 2024 Aug 20;12(8):1897. doi: 10.3390/biomedicines12081897. Biomedicines. 2024. PMID: 39200361 Free PMC article.
-
Denver Papillae Protocol for Objective Analysis of Fungiform Papillae.J Vis Exp. 2015 Jun 8;(100):e52860. doi: 10.3791/52860. J Vis Exp. 2015. PMID: 26131644 Free PMC article.
-
The tongue map and the spatial modulation of taste perception.Curr Res Food Sci. 2022 Mar 18;5:598-610. doi: 10.1016/j.crfs.2022.02.004. eCollection 2022. Curr Res Food Sci. 2022. PMID: 35345819 Free PMC article. Review.
-
Investigation of the fungiform papillae number in children with tooth number anomalies.Clin Oral Investig. 2024 May 3;28(5):297. doi: 10.1007/s00784-024-05696-1. Clin Oral Investig. 2024. PMID: 38700604 Free PMC article.
References
-
- Arvidson K. Scanning electron microscopy of fungiform papillae on the tongue of man and monkey. Acta Otolaryngol. 1976;81(5-6):496–502. - PubMed
-
- Arvidson K. Location and Variation in Number of Taste-Buds in Human Fungiform Papillae. Scandinavian Journal of Dental Research. 1979;87(6):435–442. - PubMed
-
- Bajec M, Pickering G. Thermal taste, PROP responsiveness, and perception of oral sensations. Physiology & Behavior. 2008;95(4):581–590. - PubMed
-
- Bakke A, Vickers Z. Consumer liking of refined and whole wheat breads. J Food Sci. 2007;72(7):S473–80. - PubMed
Grants and funding
LinkOut - more resources
Full Text Sources
Other Literature Sources