. 2014 Sep 29:3:228.
doi: 10.12688/f1000research.5369.1. eCollection 2014.

A novel mouse model of creatine transporter deficiency

Affiliations

A novel mouse model of creatine transporter deficiency

Laura Baroncelli et al. F1000Res. .

Abstract

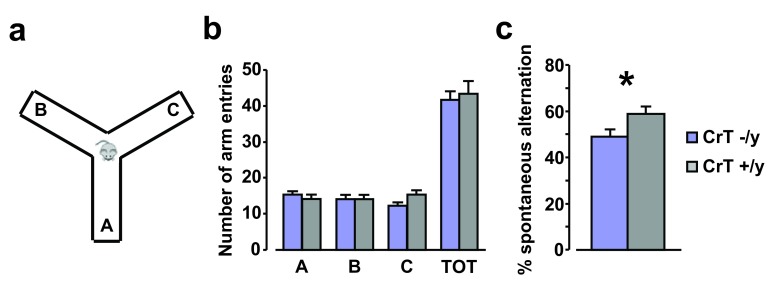
Mutations in the creatine (Cr) transporter (CrT) gene lead to cerebral creatine deficiency syndrome-1 (CCDS1), an X-linked metabolic disorder characterized by cerebral Cr deficiency causing intellectual disability, seizures, movement and behavioral disturbances, language and speech impairment ( OMIM #300352). CCDS1 is still an untreatable pathology that can be very invalidating for patients and caregivers. Only two murine models of CCDS1, one of which is an ubiquitous knockout mouse, are currently available to study the possible mechanisms underlying the pathologic phenotype of CCDS1 and to develop therapeutic strategies. Given the importance of validating phenotypes and efficacy of promising treatments in more than one mouse model we have generated a new murine model of CCDS1 obtained by ubiquitous deletion of 5-7 exons in the Slc6a8 gene. We showed a remarkable Cr depletion in the murine brain tissues and cognitive defects, thus resembling the key features of human CCDS1. These results confirm that CCDS1 can be well modeled in mice. This CrT (-/y) murine model will provide a new tool for increasing the relevance of preclinical studies to the human disease.


Conflict of interest statement

Competing interests: No competing interests were disclosed.

Figures

Figure 1.
Figure 1.. Sketch of the strategy for generation of a null Slc6a8 mouse.
A targeting vector was obtained from KOMP to generate mice carrying a floxed allele. Crossing these mice with a Flp deleter mouse line produced a conditional KO mouse line (cKO allele). Crossing this line with a line expressing Cre-recombinase in the germline produced the Slc6a8 null mouse used in this study (KO allele). 1F, 1R, 2F, 2R, 3F, 3F’, 3R, 4F, 4R report the sites targeted by the PCR primers to assess allele presence.
Figure 2.
Figure 2.. Body weight is lower in CrT –/y animals at two months of age.
At P60 the weight of CrT –/y mice was significantly reduced compared to CrT +/y animals (CrT –/y: 18.75 ± 0.78 g, CrT +/y: 22.77 ± 0.90 g; t test, p < 0.01). *, statistical significance. Error bars, s.e.m.
Figure 3.
Figure 3.. Normal behavior of CrT mutant mice in the open field arena.
( a, b) CrT –/y (n = 9) and CrT +/y mice (n = 9) spent a comparable amount of time in the center (CrT –/y: 75.16 ± 10.82 s, CrT +/y: 67.60 ± 18.11 s; a) and in the peripheral region (CrT –/y: 524.41 ± 10.87 s, CrT +/y: 526.52 ± 18.45 s; b) of the open field arena. A Two-Way ANOVA analysis shows no significant effect of genotype for both comparisons (p = 0.725 and p = 0.922, respectively). ( c) Walking speed of animals during the exploration of open field arena. We found no significant difference (CrT –/y: 7.85 ± 0.43 cm/s, CrT +/y: 7.65 ± 0.71 cm/s; t test, p = 0.807). ( d) The total distance moved in the open field arena did not differ between CrT mutants (4706.34 ± 258.75 cm) and WT animals (4535.28 ± 427.11 cm; t test, p = 0.736). ( e) Representative examples of movement path during the open field session for a CrT –/y (left) and a CrT +/y mouse (right). Error bars, s.e.m.
Figure 4.
Figure 4.. CrT deletion leads to cognitive deficits in object recognition memory.
( a) On the left, a schematic representation of the sample condition in object recognition task. Histograms depict the performance of CrT –/y and CrT +y during the sample phase: no difference in the total exploration time of objects was detected between the experimental groups (CrT –/y: n = 8, exploration time = 56.91 ± 5.40 s; CrT +/y : n = 6, exploration time = 67.20 ± 10.23 s; t test, p = 0.358). ( b) On the left, a schematic diagram of the test condition. Histograms display object discrimination indexes of CrT –/y and CrT +y during the testing phase: a significantly lower discrimination index was found in CrT –/y mice (0.261 ± 0.053) compared to CrT +y animals (0.448 ± 0.059; t test, p < 0.05). *, statistical significance. Error bars, s.e.m.
Figure 5.
Figure 5.. Impairment of Y-maze spontaneous alternation rate in CrT –/y mice.
( a) Schematic diagram of the Y maze apparatus. ( b) Histograms depict the mean number of entries in the single arms of the maze (A, B, C) and the total number of arm entries for the different experimental groups: animals of both groups equally explored all the three arms of the maze and general exploratory behavior of CrT –/y animals (n = 9; A: 15.22 ± 1.12, B: 14.22 ± 1.08, C: 12.22 ± 1.05, TOT: 41.67 ± 2.41) was totally comparable to that exhibited by WT littermates (n = 9; A: 14.00 ± 1.26, B: 14.11 ± 1.29, C: 15.22 ± 1.27, TOT: 43.33 ± 3.58; Two-Way ANOVA, post hoc Holm-Sidak method, p = 0.640, p = 0.966, p = 0.252, p = 0.523 respectively). ( c) Alternation rate in the Y maze was significantly lower in CrT –/y mice (49.24 ± 3.20%) compared to that recorded for CrT +/y littermates (58.91 ± 2.99%; t test, p < 0.05). *, statistical significance. Error bars, s.e.m.
Figure 6.
Figure 6.. CrT deletion impairs spatial learning and memory in mutant mice.
( a) Mean swimming speed measured all along the training phase for CrT –/y and CrT +/y animals: mutant mice (14.00 ± 0.53 cm/s) resulted to be slower swimmers with respect to control littermates (16.44 ± 0.60 cm/s; t test, p < 0.05). ( b, c) Learning curves for CrT –/y (n = 9; blue) and CrT +/y mice (n = 5; grey) during the training phase. The histogram shows the mean swimming path covered to locate the submerged platform on the last three day of training for the two groups. A t-test analysis showed a statistical difference between CrT –/y (285.24 ± 37.53 cm) and CrT +/y animals (171.58 ± 23.80 cm; p < 0.05). ( d) Probe trial. A Two-Way RM ANOVA followed by Holm-Sidak multiple comparison revealed that while CrT +/y spent significantly more time in the NE quadrant than in the other ones, CrT –/y did not show any preference for the target quadrant. In addition, the percentage of time spent in the target quadrant was shorter in CrT –/y mice (30.31 ± 5.33%) than in the other group (45.73 ± 7.35%). ( e) Representative examples of swimming path during the probe session for a CrT –/y (left) and a CrT +/y mouse (right). *, statistical significance. Error bars, s.e.m.
Figure 7.
Figure 7.. Locomotor activity in CrT –/y mutant mice and the wild-type parental strain.
( a) Total horizontal distance travelled throughout 24h (left), and over the dark (middle) or light phase (right). CrT –/y mice had a significant decrease in motor activity in comparison to control animals during the whole period of testing (CrT –/y: 43,594.22 ± 2,639.39 beam crossings, CrT +/y: 65,587.63 ± 5,831.19 beam crossings) and the night phase (CrT –/y: 29,109.67 ± 1,695.35 beam crossings, CrT +/y: 48,094.13 ± 4,843.56 beam crossings; Two-Way ANOVA, post hoc Holm-Sidak method, p < 0.001 for both comparisons), while the motor behavior of the two groups was similar in the day-time (CrT –/y: 14,484.56 ± 1,458.08 beam crossings, CrT +/y: 17,493.50 ± 2,957.57 beam crossings; p = 0.535). ( b) Time course of horizontal activity of CrT –/y (blue) and CrT +/y (grey) animals during 24h. Data are plotted as total number of beam crossings ± SEM in each time block of 60 min. Dark and light phases are indicated. *, statistical significance. Error bars, s.e.m.

References

    1. Acosta ML, Kalloniatis M, Christie DL: Creatine transporter localization in developing and adult retina: importance of creatine to retinal function. Am J Physiol Cell Physiol. 2005;289(4):C1015–1023. 10.1152/ajpcell.00137.2005 - DOI - PubMed
    1. Alessandri MG, Celati L, Battini R, et al. : Gas chromatography/mass spectrometry assay for arginine: glycine-amidinotransferase deficiency. Anal Biochem. 2005;343(2):356–358. 10.1016/j.ab.2005.05.003 - DOI - PubMed
    1. Anselm IA, Alkuraya FS, Salomons GS, et al. : X-linked creatine transporter defect: a report on two unrelated boys with a severe clinical phenotype. J Inherit Metab Dis. 2006;29(1):214–219. 10.1007/s10545-006-0123-4 - DOI - PMC - PubMed
    1. Baroncelli L, Alessandrì MG, Tola J, et al. : Dataset 1. Data for neurochemical and behavioral assessment in a mouse model of creatine deficiency. F1000Research. 2014. Data Source - DOI
    1. Battini R, Leuzzi V, Carducci C, et al. : Creatine depletion in a new case with AGAT deficiency: clinical and genetic study in a large pedigree. Mol Genet Metab. 2002;77(4):326–331. 10.1016/S1096-7192(02)00175-0 - DOI - PubMed