. 2014 Sep 20;1(3):181-191.
doi: 10.1364/OPTICA.1.000181.

Two-photon instant structured illumination microscopy improves the depth penetration of super-resolution imaging in thick scattering samples

Affiliations

Two-photon instant structured illumination microscopy improves the depth penetration of super-resolution imaging in thick scattering samples

Peter W Winter et al. Optica. .

Abstract

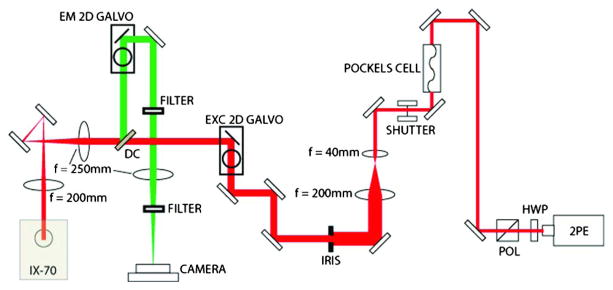
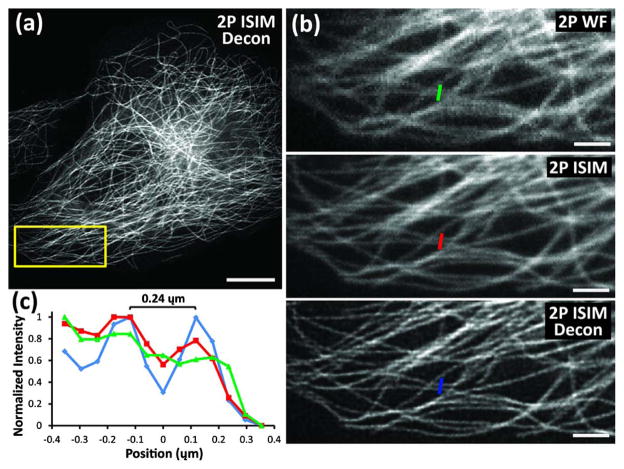
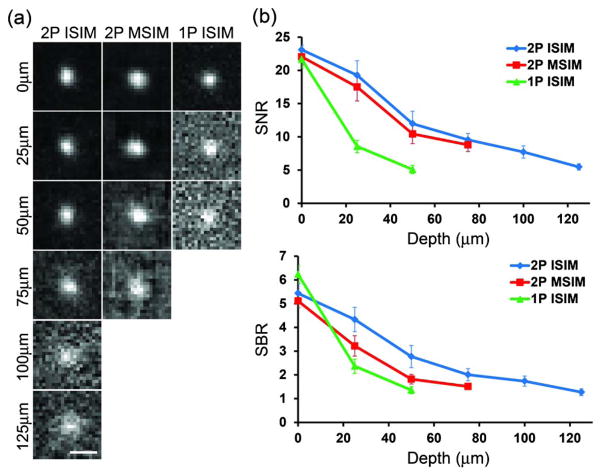
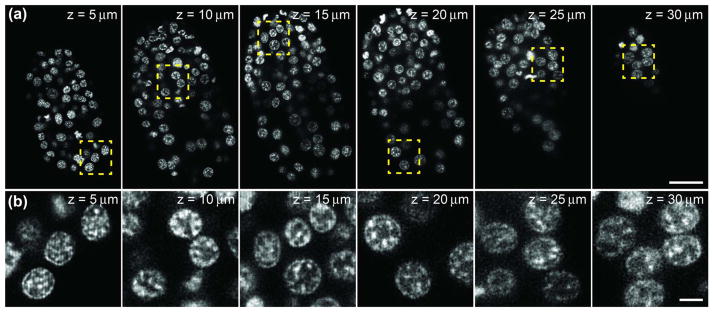
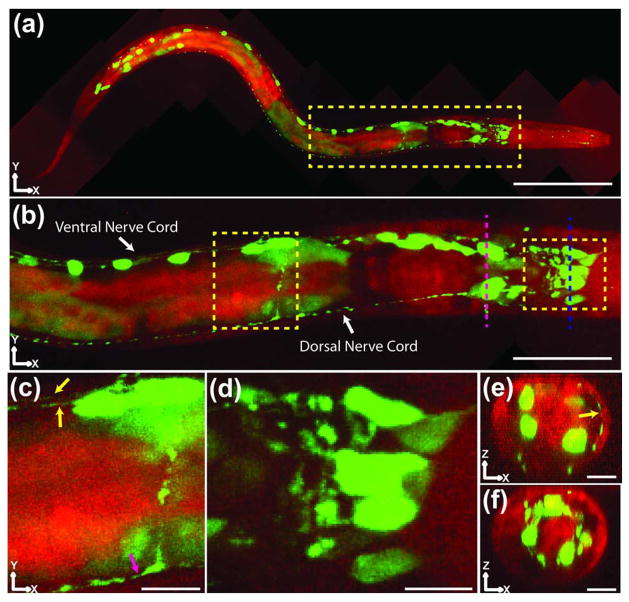
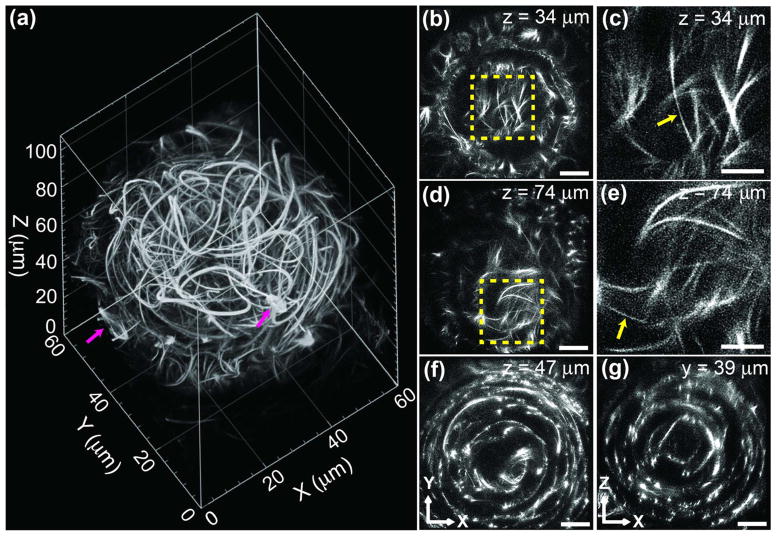
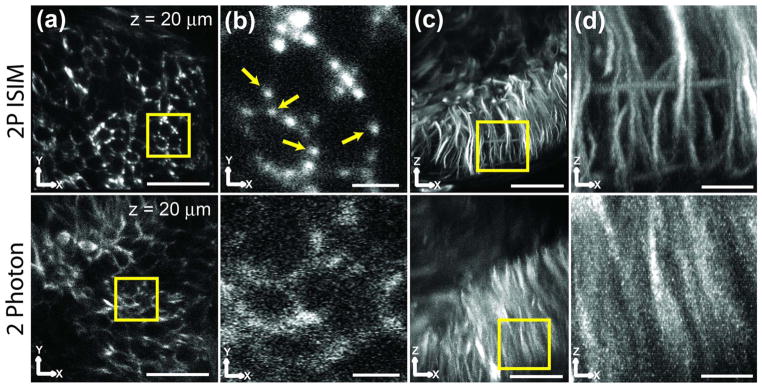
Fluorescence imaging methods that achieve spatial resolution beyond the diffraction limit (super-resolution) are of great interest in biology. We describe a super-resolution method that combines two-photon excitation with structured illumination microscopy (SIM), enabling three-dimensional interrogation of live organisms with ~150 nm lateral and ~400 nm axial resolution, at frame rates of ~1 Hz. By performing optical rather than digital processing operations to improve resolution, our microscope permits super-resolution imaging with no additional cost in acquisition time or phototoxicity relative to the point-scanning two-photon microscope upon which it is based. Our method provides better depth penetration and inherent optical sectioning than all previously reported super-resolution SIM implementations, enabling super-resolution imaging at depths exceeding 100 μm from the coverslip surface. The capability of our system for interrogating thick live specimens at high resolution is demonstrated by imaging whole nematode embryos and larvae, and tissues and organs inside zebrafish embryos.


Figures

Fig. 1
Fig. 1
Pulsed femtosecond laser (2PE) provides two-photon excitation to the sample (red), and fluorescence (green) is collected and imaged onto a camera. The remaining elements are used to shape, modulate, shutter, or scan the excitation, or scan and filter the emission (see text for more detail). Symbol key: HWP, half wave plate; POL, polarizer; EXC 2D GALVO, galvanometric mirror used to scan the excitation through the sample; DC, dichroic mirror; IX-70, microscope frame used to house the objective and sample (not shown); EM 2D GALVO, galvanometric mirror used to rescan the emission. Reflective mirrors are shown as rectangles, and other lenses referred to in the text are shown as ellipsoids with focal lengths as indicated. Note that the drawing is not to scale.
Fig. 2
Fig. 2
Resolution enhancement in two-photon instant structured illumination microscopy (2P ISIM). (a) Immunolabeled microtubules in a fixed U2OS human osteosarcoma cell, as viewed in 2P ISIM, after deconvolution. (b) Higher-magnification view of the yellow rectangular region in (a), emphasizing resolution differences between images taken in 2P widefield (2P WF), 2P ISIM, and deconvolved 2P ISIM modes. (c) Line-outs of microtubules marked in green, red, and blue in (b). Scale bar: 10 μm in (a) and 3 μm in (b). See also Fig. S7 in Supplement 1.
Fig. 3
Fig. 3
Two-photon ISIM improves SNR and SBR relative to single-photon implementations. (a) Representative images of subdiffractive fluorescent beads in a scattering matrix, as observed in 2P ISIM, 2P MSIM, and 1P ISIM systems. All images are autoscaled independently, and “0 μm” corresponds to the coverslip surface. Scale bar: 500 nm. The limited range of the 2P MSIM piezo stage prevented us from comparing 2P ISIM and 2P MSIM at depths greater than 75 μm from the coverslip, and data are not shown for depths further than 50 μm from the coverslip for the 1P ISIM system due to low SBR. (b) Graphs indicating falloff in SNR and SBR as a function of depth from the coverslip surface. Means and standard deviations are indicated from measurements taken on 6 beads at each depth (see also Fig. S9 in Supplement 1). Note that these images were not deconvolved.
Fig. 4
Fig. 4
Two-photon ISIM enables visualization of subnuclear chromatin structure throughout nematode embryos. (a) Selected slices at indicated axial distance from the coverslip, through a live nematode embryo (bean stage). Scale bar: 10 μm. (b) Higher magnification views of yellow rectangular regions in (a), emphasizing subnuclear chromatin structure throughout the imaging volume. Scale bar: 2 μm. All images have been deconvolved. See also Media 1.
Fig. 5
Fig. 5
Two-color, 2P ISIM imaging in a live, anesthetized nematode larva. (a) Ten 2P ISIM volumes were acquired and stitched together to generate a two-color (green, GFP; red, blue-shifted autofluorescence) XY maximum intensity projection of an L2 nematode larva expressing transcriptional reporter psax-3::GFP, which is widely expressed throughout the nervous system. The head of the animal lies to the right, while the tail is located to the left. The yellow rectangle denotes the nerve ring and anterior portion of the nematode gut. Scale bar: 60 μm. (b) Higher-magnification view of the yellow rectangular region in (a), emphasizing nerve cords and nerve ring. Numerous head neurons and ventral cord motor neurons are visible in this view, as well as autofluorescent structures like the terminal bulb of the pharynx and the intestine. Scale bar: 20 μm. (c), (d) Higher-magnification views of yellow rectangular regions in (b). The yellow arrows show both the left and right fascicles of the ventral nerve cord, while the magenta arrow denotes the dorsal nerve cord. A neuronal process connecting the dorsal and ventral nerve cords is visible just anterior to the magenta arrow. In (d), neurons and neuronal processes in the nematode head can be resolved. Scale bar: 4 μm in (c), (d). The green colormap has been saturated in order to highlight dim neurites and subneuronal structures. (e), (f) Axial cuts through the imaging volume, corresponding to magenta and blue dashed lines in (b). Head neurons are visible in both views, while a neurite crossing the dorsal region of the head is denoted by a yellow arrow in (e). Scale bar: 5 μm. Neurites and fasciculating neurites denoted by yellow arrows in (c) and (e) have apparent lateral width <200 nm. All images were deconvolved. See also Media 3.
Fig. 6
Fig. 6
2P ISIM enables super-resolution imaging in volumes of ~100 μm thickness. (a) Rendering of ~60 × 60 × 110 μm volume (eye of 38–40 h old, live zebrafish embryo) captured with 2P ISIM. Single microtubules, bundles of microtubules, and dividing cells (magenta arrows) are visible in the volume. See also Media 4. (b), (d), (f) XY slices at indicated axial (Z) distance from the base of the stack. See also Media 5. Scale bar: 10 μm. (c), (e) Higher-magnification views of the yellow regions in (b), (d), emphasizing thin filaments (yellow arrows) with apparent width <200 nm. Scale bar: 5 μm. (g) XZ slice at indicated lateral (Y) distance from the origin of the stack, emphasizing concentric, circular cytoskeletal organization within the eye. Scale bar: 10 μm. All data presented in this figure were deconvolved.
Fig. 7
Fig. 7
2P ISIM provides better resolution and SNR than conventional 2P microscopy. The same brain region in a zebrafish embryo was imaged in 2P ISIM (top row) and on a conventional, point-scanning 2P system (the Leica SP5, bottom row). (a) XY slices ~20 μm from the coverslip. Scale bar: 20 μm. (b) Higher-magnification views of region marked by the yellow square in (a). Scale bar: 3 μm. Yellow arrows indicate individual microtubule bundles. (c) XZ maximum intensity projections of the volumes. Scale bar: 20 μm. (d) Higher-magnification views of the region marked by the yellow square in (c). Scale bar: 5 μm. Images are raw, i.e., they have not been deconvolved. See also Media 6 and Media 7.

References

    1. Fischer RS, Wu Y, Kanchanawong P, Shroff H, Waterman CM. Microscopy in 3D: a biologist’s toolbox. Trends Cell Biol. 2011;21:682–691. - PMC - PubMed
    1. Wu Y, Christensen R, Colon-Ramos D, Shroff H. Advanced optical imaging techniques for neurodevelopment. Curr Opin Neurobiol. 2013;23:1090–1097. - PMC - PubMed
    1. Cox S, Jones GE. Imaging cells at the nanoscale. Int J Biochem Cell Biol. 2013;45:1669–1678. - PubMed
    1. Hell SW, Reiner G, Cremer C, Stelzer EHK. Aberrations in confocal fluorescence microscopy induced by mismatches in refractive index. J Microsc. 1993;169:391–405.
    1. Wilson BC, Jacques SL. Optical reflectance and transmittance of tissues: principles and applications. IEEE J Quantum Electron. 1990;26:2186–2199.