. 2014;13(20):3241-8.
doi: 10.4161/15384101.2014.953876.

Temporal separation of replication and transcription during S-phase progression

Affiliations

Temporal separation of replication and transcription during S-phase progression

Matthieu Meryet-Figuiere et al. Cell Cycle. 2014.

Abstract

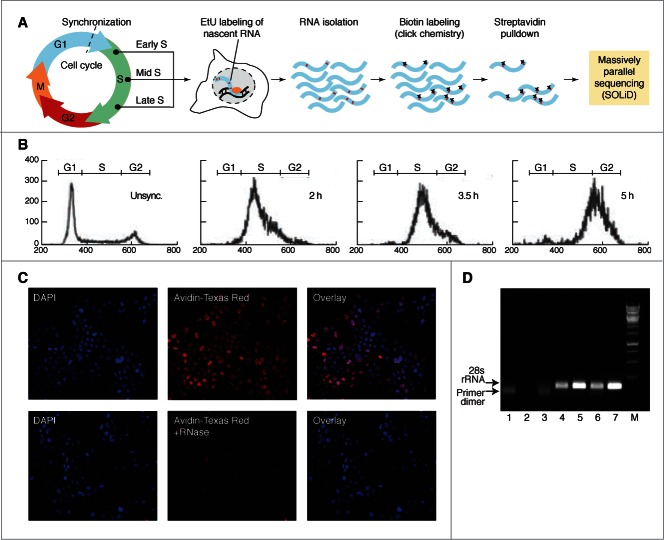
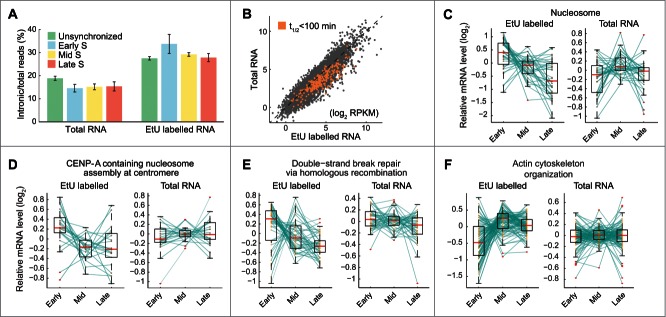
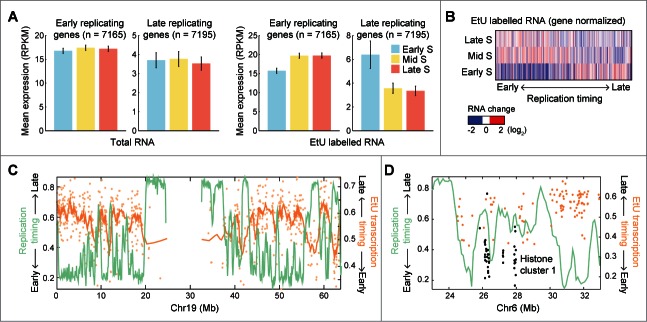
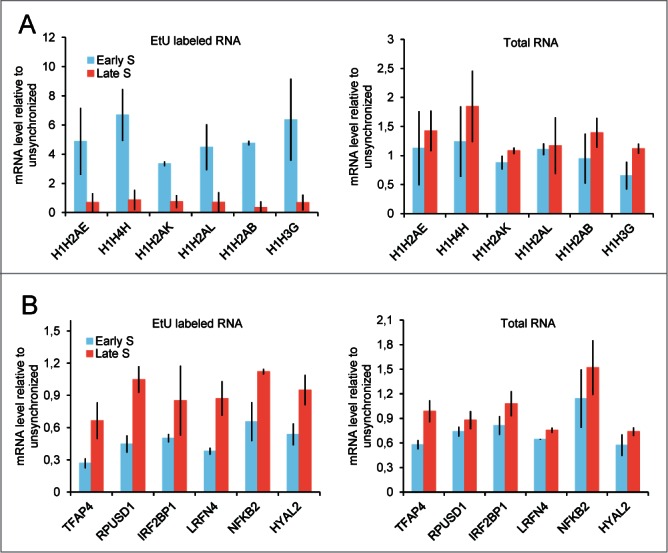
Transcriptional events during S-phase are critical for cell cycle progression. Here, by using a nascent RNA capture assay coupled with high-throughput sequencing, we determined the temporal patterns of transcriptional events that occur during S-phase. We show that genes involved in critical S-phase-specific biological processes such as nucleosome assembly and DNA repair have temporal transcription patterns across S-phase that are not evident from total RNA levels. By comparing transcription timing with replication timing in S-phase, we show that early replicating genes show increased transcription late in S-phase whereas late replicating genes are predominantly transcribed early in S-phase. Global anti-correlation between replication and transcription timing was observed only based on nascent RNA but not total RNA. Our data provides a detailed view of ongoing transcriptional events during the S-phase of cell cycle, and supports that transcription and replication are temporally separated.

Keywords: Cell cycle; Ethynyl Uridine, EtU; Replication; Replication timing; S-phase; Transcription.


Figures

Figure 1.
Figure 1.
Isolation of nascent RNA at different stages of S-phase progression. (A) Flow chart describing the outline of the nascent RNA capture assay. Cells were synchronized and nascent RNA was isolated by pulsing cells with EtU at 3 timepoints of the S-phase. RNA was subjected to SOLiD sequencing. (B) Flow cytometry showing position of the cell population in cell cycle. Unsync: unsynchronized cells, 2 h, 3.5 h and 5 h: 2 hours, 3.5 hours and 5 hours after block release respectively. (C) EtU incorporation in RNA and not in DNA. Following EtU labeling and Click-IT reaction to add biotin moiety to EtU, the unsynchronized HeLa cells were immunostained using avidin coupled to Texas red (red color). Cell nuclei were stained with DAPI (blue color). (D) Pulldown is specific for EtU treated RNA. Agarose gel picture showing the semi-quantitative RT-PCR products of 28 s RNA. Lanes 1-3: non EtU treated HeLa cell RNA pull down. Lanes 4-6: EtU treated HeLa RNA pull down. Lane 7: control RNA (no pull down).
Figure 2.
Figure 2.
Temporal transcription patterns during HeLa S-phase determined using massively parallel sequencing. (A) Comparison of total RNA and EtU-labeled (nascent) RNA with respect to percentage intronic reads shows elevated intronic read coverage in the labeled data. Intronic and total read counts (intronic + exonic) were determined individually for all expressed genes (>20 reads). Bars show average percentages and error bars indicate +/− SEM. (B) Scatterplot of expression levels obtained based on nascent RNA (x-axis) and total RNA (y-axis), for individual expressed genes in unsynchronized cells (Pearson's r = 0.91). The majority of a set of 243 unstable mRNAs (half-live < 100 minutes, defined using available stability data15) showed reduced total RNA levels relative to their production rates (EtU labeled data). (C–F) Genes associated with nucleosome, CENP-A nucleosome and double strand break repair GO terms showed elevated transcription in early s-phase, as indicated by the EtU labeled data. Actin cytoskeleton-related genes showed peak transcription in mid S-phase. Levels were normalized relative to the mean expression of each gene across all time points. Box plots: bars correspond to the median and the central boxes span the middle quartiles. Green lines connect each gene throughout the time series. RPKM, reads-per-kilobase-per-million reads; t1/2, half-life.
Figure 3.
Figure 3.
Relationship between replication timing and transcription during S-phase. (A) Late replicating genes on average show reduced transcription in late S-phase. Replication timing data from HeLa was used to define sets of early and late replicating genes (lower and upper quartiles). Bars show average expression levels (+/− SEM) for these gene sets throughout S-phase. Results based on steady state RNA and EtU labeled nascent RNA are shown separately. (B) Heat map of relative EtU-based expression profiles for individual genes, ranked by their replication timing. Early replicating genes typically show lower expression levels in early compared to late S phase, and vice versa. Only expressed genes (minimum 20 reads in one time point) were considered. (C) Inverse relationship between replication and expression timing on chromosome 19. Expression patterns in S-phase were transformed into continuous scores reflecting the timing of expression (see Fig. S3 and Methods). Expression timing for individual expressed genes is shown as light orange dots, while the darker orange line shows a moving average (n = 10 genes). (D) Detailed view of replication and expression timing near the HIST1 histone cluster on chromosome 6, with histone genes indicated in black.
Figure 4.
Figure 4.
Inverse correlation between transcription and replication timing confirmed by RT-qPCR. (A) Nascent transcripts analysis show a higher transcription rate in early S-phase compared to late S-phase for late replicating genes, whereas total RNA does not. H1H2AE, H1H4H, H1H2AK, H1H2AL, H1H2AB and H1H3G histone genes are part of “nucleosome” gene set, and are located in histone cluster 1 on chromosome 6. (B) Nascent transcripts analysis show a higher transcription rate in late S-phase compared to early S-phase for early replicating genes, whereas total RNA does not. TFAP4, RPUSD1, IRF2BP1, LRFN4, NFKB2 and HYAL2 were randomly picked among the earliest replicating genes. (A and B) RNA from synchronized cells were EtU labeled, purified (see Fig. 1A and experimental procedures) and converted to cDNA. Total RNA from unlabeled cells were used as a control. Gene expression levels were measured by q-PCR and standardized with OCRL, which is expressed uniformly across S-phase in EtU and Total RNA according to sequencing data. Expression levels are relative to unsynchronized cells. Error bars represent standard deviation from 2 experiments.

References

    1. Whitfield ML, Sherlock G, Saldanha AJ, Murray JI, Ball CA, Alexander KE, Matese JC, Perou CM, Hurt MM, Brown PO, et al. . Identification of genes periodically expressed in the human cell cycle and their expression in tumors. Mol biol Cell 2002; 13:1977-2000; PMID:12058064; http://dx.doi.org/10.1091/mbc.02-02-0030 - DOI - PMC - PubMed
    1. Grant GD, Brooks L, 3rd, Zhang X, Mahoney JM, Martyanov V, Wood TA, Sherlock G, Cheng C, Whitfield ML. Identification of cell cycle-regulated genes periodically expressed in U2OS cells and their regulation by FOXM1 and E2F transcription factors. Mol biol Cell 2013; 24:3634-50; PMID:24109597; http://dx.doi.org/10.1091/mbc.E13-05-0264 - DOI - PMC - PubMed
    1. Cho RJ, Huang M, Campbell MJ, Dong H, Steinmetz L, Sapinoso L, Hampton G, Elledge SJ, Davis RW, Lockhart DJ. Transcriptional regulation and function during the human cell cycle. Nat Genet 2001; 27:48-54; PMID:11137997 - PubMed
    1. Oliva A, Rosebrock A, Ferrezuelo F, Pyne S, Chen H, Skiena S, Futcher B, Leatherwood J. The cell cycle-regulated genes of Schizosaccharomyces pombe. PLoS Biol 2005; 3:e225; PMID:15966770 - PMC - PubMed
    1. van der Meijden CM, Lapointe DS, Luong MX, Peric-Hupkes D, Cho B, Stein JL, van Wijnen AJ, Stein GS. Gene profiling of cell cycle progression through S-phase reveals sequential expression of genes required for DNA replication and nucleosome assembly. Cancer Res 2002; 62:3233-43; PMID:12036939 - PubMed

Publication types