. 2015 Jan;125(1):292-303.
doi: 10.1172/JCI76238. Epub 2014 Dec 8.

Follicular helper T cell signature in type 1 diabetes

Follicular helper T cell signature in type 1 diabetes

Rupert Kenefeck et al. J Clin Invest. 2015 Jan.

Abstract

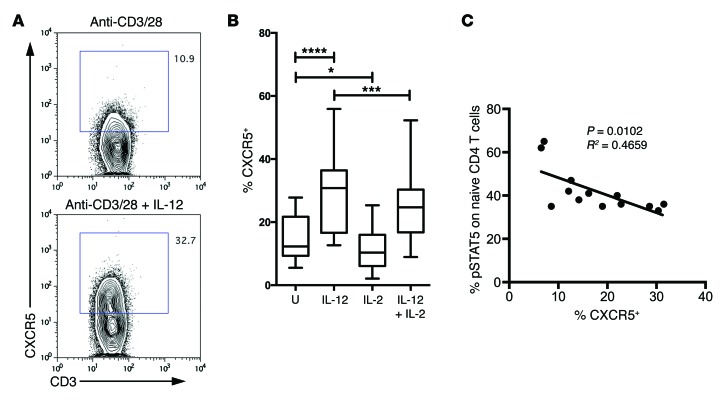
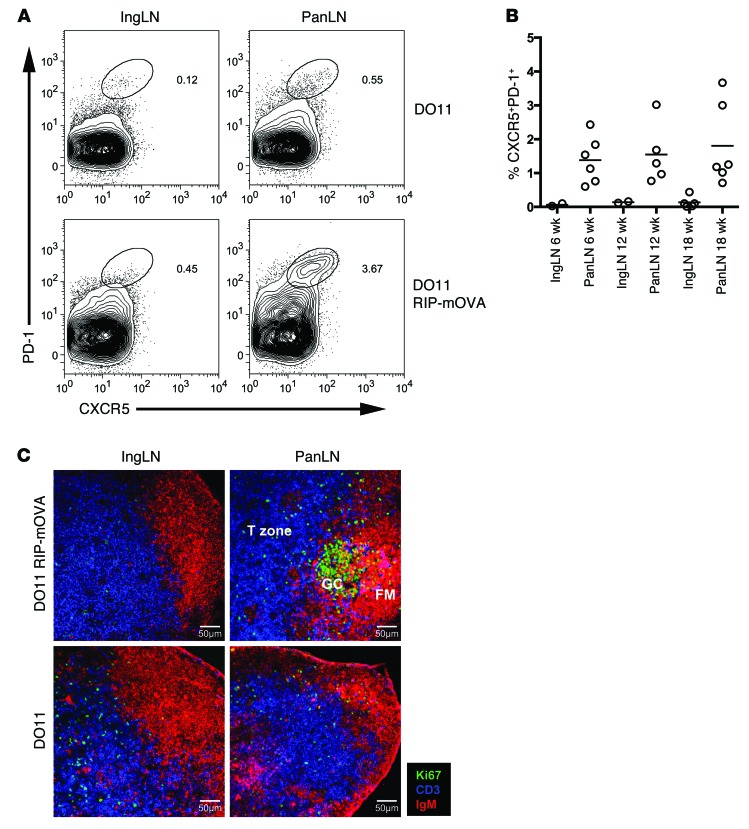
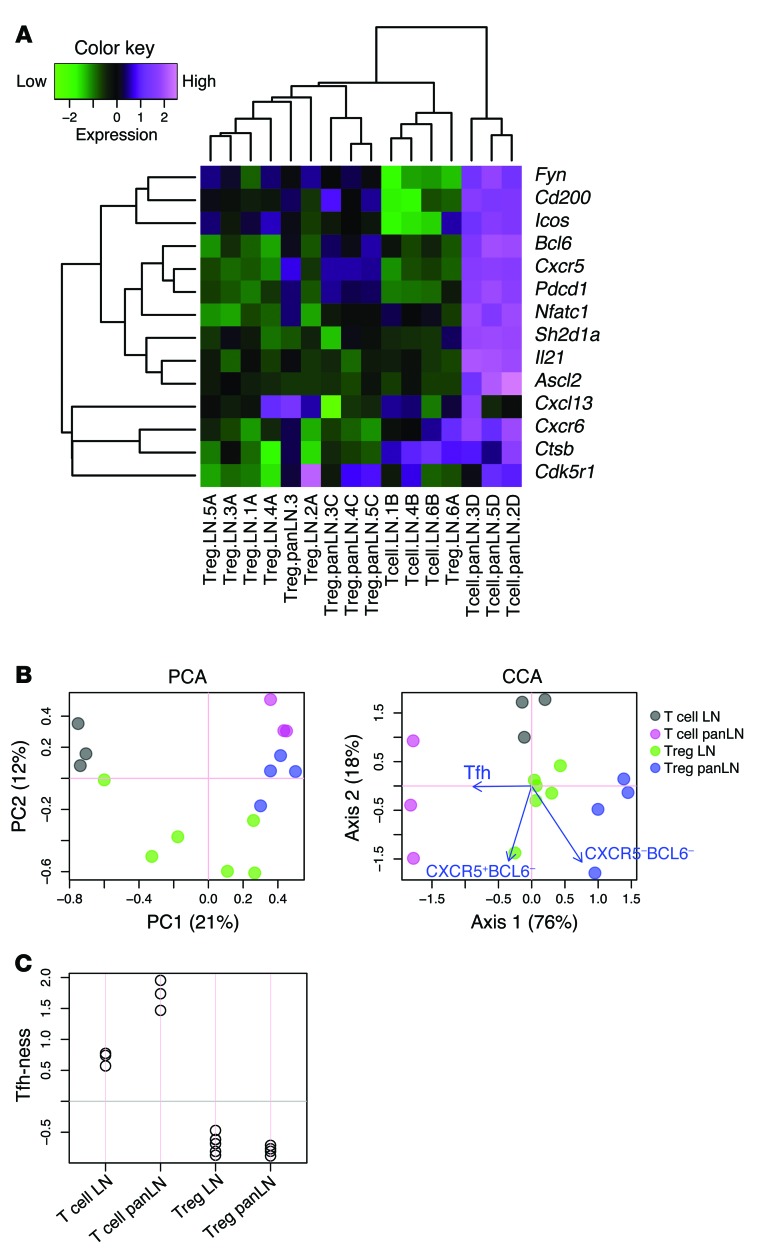
The strong genetic association between particular HLA alleles and type 1 diabetes (T1D) indicates a key role for CD4+ T cells in disease; however, the differentiation state of the responsible T cells is unclear. T cell differentiation originally was considered a dichotomy between Th1 and Th2 cells, with Th1 cells deemed culpable for autoimmune islet destruction. Now, multiple additional T cell differentiation fates are recognized with distinct roles. Here, we used a transgenic mouse model of diabetes to probe the gene expression profile of islet-specific T cells by microarray and identified a clear follicular helper T (Tfh) cell differentiation signature. Introduction of T cells with a Tfh cell phenotype from diabetic animals efficiently transferred diabetes to recipient animals. Furthermore, memory T cells from patients with T1D expressed elevated levels of Tfh cell markers, including CXCR5, ICOS, PDCD1, BCL6, and IL21. Defects in the IL-2 pathway are associated with T1D, and IL-2 inhibits Tfh cell differentiation in mice. Consistent with these previous observations, we found that IL-2 inhibited human Tfh cell differentiation and identified a relationship between IL-2 sensitivity in T cells from patients with T1D and acquisition of a Tfh cell phenotype. Together, these findings identify a Tfh cell signature in autoimmune diabetes and suggest that this population could be used as a biomarker and potentially targeted for T1D interventions.


Figures

Figure 8
Figure 8. Patients who respond poorly to IL-2 show an increased propensity to upregulate CXCR5.
(A) Sorted CD4+CD45RA+ naive T cells from patients with T1D were cultured for 5 days with anti-CD3/anti-CD28 beads in the presence or absence of IL-12. Plots show representative CXCR5 staining. The percentage of gated CXCR5+ cells is shown on the graph. (B) Graphs show CXCR5 MFI of 5 independent experiments in which naive T cells were cultured for 5 days as above with IL-12 and or IL-2 (n = 15). Box and whisker plots show the median, interquartile range, and 10th to 90th percentile. *P ≤ 0.05, ***P ≤ 0.001, ****P ≤ 0.0001. U, untreated. (C) Relationship between CXCR5 induction and sensitivity of T cells to IL-2. CD4+ T cells from patients with T1D were treated with 100 U IL-2 for 10 minutes and then fixed and stained for phosphorylated STAT5 (pSTAT5). The percentage of pSTAT5+ is plotted against the proportion of CXCR5+ cells induced by culture in the presence of IL-12 (as in A and B) (n = 13).
Figure 7
Figure 7. IL-21–producing CD4+ T cells are elevated in patients with T1D and correlate strongly with the proportion of CXCR5+ cells.
(A) Frequencies of CD4 T cells producing the indicated cytokines following 14-hour anti-CD3 stimulation of cells from patients with T1D (n = 22) and healthy controls (n = 13). Box and whisker plots show the median, interquartile range, and 10th to 90th percentile. (B) Frequencies of cells producing a defined combination of cytokines (as shown) within the stimulated CD4+ T cell population in patients with T1D (n = 22) and healthy controls (n = 13). *P ≤ 0.05, **P ≤ 0.01, ***P ≤ 0.001. Bars show the mean, and error bars show the SEM. (C) Distribution of cytokine production within the CD4+ IL-21–producing population showing that the majority of IL-21 producers coexpress TNF-α and/or IFN-γ. Data show values averaged from 22 individuals. Unlabeled segments comprise <1.5%. (D) Correlation between the frequency of IL-21+ CD4+ T cells following anti-CD3 stimulation as in A and fresh ex vivo CXCR5 expression in patients with T1D (n = 13). (E) Populations of naive (CD4+CD45RA+CXCR5), memory CXCR5 (CD4+CD45RACXCR5), and memory CXCR5+ (CD4+CD45RACXCR5+) cells were sorted by FACS from healthy controls and stimulated for 16 hours with anti-CD3/anti-CD28 beads. The proportion of cells expressing the cytokines IL-21, IL-4, IFN-γ, and IL-17 was then assessed. Bars show the mean, and error bars show the SEM.
Figure 6
Figure 6. Increased frequency of CXCR5+ T cells in patients with T1D.
(A) Representative staining of PBMCs with CXCR5 and canonical T cell memory markers CD45RA, CD62L, and CCR7. Plots are gated on CD3+CD4+ and central memory (C. memory) and effector memory (E. memory) subsets as shown. The percentage of events within each quadrant (top left) is shown on the graph, and the frequency of CXCR5+ events within the naive, central memory, and effector memory fraction is shown as boxed on each subsequent plot. (B) The proportions of CD4+CXCR5+ T cells that fall into naive (CD4+CD45RA+CD62L+), central memory (CD4+CD45RACD62L+), and effector memory (CD4+CD45RACD62L) subsets in patients with T1D (n = 24) and healthy controls (n = 15). Central horizontal bars depict the mean and are spanned by bars showing the SEM. (C) Frequencies of CXCR5+ cells within naive, central memory, and effector memory CD4 T cell subsets in patients with T1D (n = 24) and healthy controls (n = 15). (D) A subset of the above individuals was examined for coexpression of CXCR5 and ICOS. Graph shows the percentage of CXCR5+ICOS+ cells within CD3+CD4+ T cells of patients with T1D (n = 11) and healthy controls (n = 9). Box and whisker plots show the median, interquartile range, and 10th to 90th percentile.
Figure 5
Figure 5. mRNA analysis of memory T cells from patients with T1D reveals a Tfh cell phenotype.
Realtime PCR analysis of memory CD4+CD45RA T cells negatively selected by magnetic cell separation from the blood of 17 patients with T1D (T1D) and 17 healthy controls (Con). Graphs show expression levels of the indicated target gene relative to GAPDH. Box and whisker plots show the median, interquartile range, and 10th to 90th percentile. P values greater than 0.05 are considered not significant.
Figure 4
Figure 4. Enrichment for Tfh cells leads to preferential transfer of disease.
(A) RIP-mOVA Cd28–/– mice were adoptively transferred with CXCR5-depleted or CXCR5-enriched DO11 T cells sorted from the PanLNs of DO11 RIP-mOVA mice. Blood glucose readings 4 weeks after transfer. **P < 0.01. Central horizontal bars depict the mean and are spanned by bars showing the SEM. (B) Representative pancreas sections stained for T cells (blue) and insulin (brown) are shown (n = 5). Original magnification, ×20.
Figure 3
Figure 3. IL-21 production at sites of autoantigen expression in DO11 RIP-mOVA mice.
(A) Representative intracellular cytokine staining for IL-21 in CD4+FOXP3 cells (Tconv) and CD4+FOXP3+ cells (Tregs) isolated from the PanLNs or pancreata of 12-week-old DO11 RIP-mOVA mice. The percentage of CD4+CD3+ cells that are IL-21+ or IL-21 is shown. (B) IL-21 expression in conventional (CD4+FOXP3) T cells in the inguinal LNs, PanLN, spleens (Spl), and pancreata (Panc) of 6- to 10-week-old DO11 RIP-mOVA mice. Horizontal bars indicate the mean. (C) Intracellular cytokine staining for IL-21, IL-17, TNF-α, and IFN-γ in conventional (CD4+FOXP3) T cells isolated from the pancreata of DO11 RIP-mOVA mice. Plots shown are from an 11-week-old animal (blood glucose: 363 mg/dl). The frequency of events that fall within each quadrant is shown. (D) Collated data showing the percentage of IL-21+ cells in the pancreata of DO11 RIP-mOVA mice that coexpress IL-17, TNF-α, or IFN-γ (n = 5). ***P < 0.001, ****P < 0.00001. Central horizontal bars depict the mean and are spanned by bars showing the SEM.
Figure 2
Figure 2. Tfh cells are detected at sites of autoantigen expression in DO11 RIP-mOVA mice.
(A) Representative staining of pancreatic and inguinal LN (IngLN) cells for Tfh cell markers in 16-week-old DO11 and DO11 RIP-mOVA mice. Plots are gated on CD4+ lymphocytes, and the percentage of CXCR5+PD-1+ events within each oval gate is shown. (B) Frequencies of Tfh cells in the PanLNs and inguinal LNs of prediabetic (6 week) and diabetic (12 and 18 week) DO11 RIP-mOVA mice. Horizontal bars indicate the mean. (C) Confocal imaging of PanLNs and inguinal LNs from DO11 RIP-mOVA and DO11 mice: Ki67 (green), CD3 (blue), IgM (red). Images shown are from 18-week-old animals. GC, germinal center; FM, follicular mantel. Scale bar: 50 μm.
Figure 1
Figure 1. Islet-specific conventional T cells in the PanLNs of DO11 RIP-mOVA mice have a Tfh gene signature.
Microarray analysis of sorted islet-specific conventional T cells or Tregs (CD4+DO11+CD25CD69, CD4+DO11+CD25CD69+, CD4+DO11+CD25+CD69, CD4+DO11+CD25+CD69+) from the PanLNs or inguinal LNs (LN) of 6-week-old DO11 RIP-mOVA mice. (A) Heat map analysis of microarray data (3–6 replicates for each sort) using a panel of Tfh cell signature genes. PanLN T cell samples cluster together and show strong upregulation of Tfh cell genes. (B) PCA and CCA analysis incorporating a publically available Tfh data set to derive a “Tfh-ness” score. Sample score plot of PCA and CCA biplots, showing sample scores (circles) and explanatory variables (arrows, obtained from a publically available Tfh data set, GSE40068), are shown. (C) Plot of “Tfh-ness” score derived from CCA analysis of the 2 sets of microarray data in B, showing relative correlations of samples to the Tfh population. Differentially expressed genes in the Tfh data set were used (n = 200). Gray line indicates the center of sample scores (0).

Comment in

References

    1. Katz JD, Benoist C, Mathis D. T helper cell subsets in insulin-dependent diabetes. Science. 1995;268(5214):1185–1188. doi: 10.1126/science.7761837. - DOI - PubMed
    1. Rabinovitch A, Suarez-Pinzon WL, Sorensen O, Bleackley RC, Power RF. IFN-gamma gene expression in pancreatic islet-infiltrating mononuclear cells correlates with autoimmune diabetes in nonobese diabetic mice. J Immunol. 1995;154(9):4874–4882. - PubMed
    1. Anderson JT, Cornelius JG, Jarpe AJ, Winter WE, Peck AB. Insulin-dependent diabetes in the NOD mouse model. II. Beta cell destruction in autoimmune diabetes is a TH2 and not a TH1 mediated event. Autoimmunity. 1993;15(2):113–122. doi: 10.3109/08916939309043886. - DOI - PubMed
    1. Han D, et al. Immune profiling by multiple gene expression analysis in patients at-risk and with type 1 diabetes. Clin Immunol. 2011;139(3):290–301. doi: 10.1016/j.clim.2011.02.016. - DOI - PMC - PubMed
    1. Kallmann BA, et al. Systemic bias of cytokine production toward cell-mediated immune regulation in IDDM and toward humoral immunity in Graves’ disease. Diabetes. 1997;46(2):237–243. - PubMed

Publication types

MeSH terms