. 2015 Jan;21(1):47-54.
doi: 10.1038/nm.3770. Epub 2014 Dec 8.

The Ashwell-Morell receptor regulates hepatic thrombopoietin production via JAK2-STAT3 signaling

Affiliations

The Ashwell-Morell receptor regulates hepatic thrombopoietin production via JAK2-STAT3 signaling

Renata Grozovsky et al. Nat Med. 2015 Jan.

Abstract

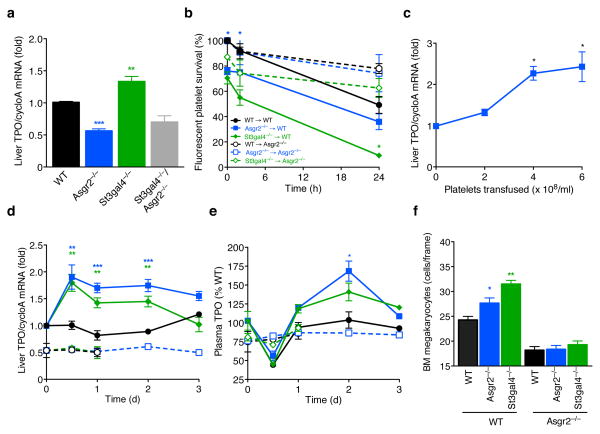
The hepatic Ashwell-Morell receptor (AMR) can bind and remove desialylated platelets. Here we demonstrate that platelets become desialylated as they circulate and age in blood. Binding of desialylated platelets to the AMR induces hepatic expression of thrombopoietin (TPO) mRNA and protein, thereby regulating platelet production. Endocytic AMR controls TPO expression through Janus kinase 2 (JAK2) and the acute phase response signal transducer and activator of transcription 3 (STAT3) in vivo and in vitro. Recognition of this newly identified physiological feedback mechanism illuminates the pathophysiology of platelet diseases, such as essential thrombocythemia and immune thrombocytopenia, and contributes to an understanding of the mechanisms of thrombocytopenia observed with JAK1/2 inhibition.


Conflict of interest statement

Disclosure: The authors have no conflicts of interest.

Figures

Figure 1
Figure 1. The Ashwell-Morell receptor regulates TPO homeostasis
(a) TPO mRNA expression in livers of WT, Asgr2−/−, St3gal4−/− and St3gal4−/−/Asgr2−/− mice. Data are mean ± SD of 15 WT, 15 Asgr2−/− 7 St3gal4−/− and 8 St3gal4−/−/Asgr2−/− mice. (b) Survival of fluorescently labeled WT (black circles), Asgr2−/− (blue squares) and St3gal4−/− (green rhombus) platelets transfused into WT (closed symbols, solid lines) or Asgr2−/− (open symbols, dashed lines) mice. (c) Dose-response of liver TPO mRNA expression in WT mice 12 h after platelet transfusion of desialylated Asgr2−/− platelets (n=5). (d) Liver TPO mRNA expression, (e) plasma TPO levels, (f) BMMK numbers and (h) blood platelet counts of WT (closed symbols, solid lines) and Asgr2−/− (open symbols, dashed lines, n=4) mice transfused with WT (black circles), Asgr2−/− (blue squares) and St3gal4−/−(green rhombus) platelets. (g) Representative bone marrow sections stained with hematoxylin and eosin. BMMK numbers were measured 3 days after injection. Each time point in each transfused animal cohort represents mean ± SD of 6 mice unless otherwise specified. *P<0.05, ** P<0.01, ***P<0.001.
Figure 2
Figure 2. JAK2-STAT3 signaling regulates hepatic TPO mRNA and protein expression in vivo
(a) Western blots analysis of total liver lysates from WT, Asgr2−/−, St3gal4−/− mice and WT mice treated with AZD1480 (WT + AZD1480) using monoclonal anti-pTyr (4G10), anti-pJAK2 (Y1007/1008), anti-JAK2, anti-pSTAT3 (Y705) and anti-STAT3 antibodies, (b) Densitometry of immunoblots for pJAK2/JAK2 (upper panel, 4 independent experiments) and pSTAT3/STAT3 (lower panel, 3 independent experiments). (c) TPO mRNA expression in livers isolated from WT vehicle (black bars), WT mice treated with AZD1480 (light grey bars) or TG101348 (dark grey bars) for 48 h and injected with Asgr2−/− or St3gal4−/− platelets. Liver TPO mRNA was measured 12 h after platelet injection. Each time point in each non-treated and transfused animals cohort represents mean ± SD of 6 mice, TG101348 experiments represents mean ± SD of 3 mice. (d) Representative immunoblots and respective densitometry of TPO protein expression in livers from WT, Asgr2−/−, St3gal4−/− mice and WT mice treated with AZD1480 (WT + AZD1480) using GAPDH as loading control (n = 3 independent experiments). *P<0.05, **P<0.01.
Figure 3
Figure 3. JAK2-STAT3 signaling regulates TPO mRNA expression in vitro
(a) Human platelets treated with sialidase (open circles) or control platelets (filled circles) were labeled with CM-Orange and incubated with HepG2 cells. Ingestion was evaluated as percentage of CM-orange positive HepG2 cells. Insert: Terminal surface β-galactose in untreated (black) and sialidase-treated (red) platelets as judged by RCA-I lectin binding. (b) TPO mRNA expression after incubation with untreated or desialylated platelets. (c) Quantification of TPO protein using a polyclonal anti-human TPO antibody in control HepG2 cells (CTR) and 6 h after addition of untreated (− sia) or desialylated (+ sia) platelets. GAPDH is shown as loading control. (d) TPO-protein quantification in the incubation media. (e) Representative immunoblots and densitometry analysis of total cell lysates using anti-pJAK2 and anti-JAK2 antibodies and (f) anti-pSTAT3 and anti-STAT3 monoclonal antibodies. n=3 (g) Immunofluorescences for pSTAT3 (1 h) and (h) human TPO-protein (6 h) of HepG2 cells incubated with untreated (− sia) and desialylated (+ sia) platelets or left untreated (Control); of HepG2 cells transfected with ASGR2 siRNA prior to desialylated platelet addition (+ sia + ASGR2 siRNA) and of HepG2 cells pretreated for 24h with AZD1480 before addition of desialylated platelets (+ sia + AZD1480). DAPI: nuclear counterstain. Scale: 20 μm. Insert: Increased magnification. Scale: 2 μm. (i) Quantification of TPO mRNA expression (6 h) in control (CRT) or cells transfected with scramble or ASGR2 siRNA, or (j) in cells pretreated for 24 h with vehicle and JAK inhibitors AZD1480, TG101348 or BMS911543, after addition of untreated (− sia) and desialylated (+ sia) platelets. n=3 *P<0.05, **P<0.01, ***P<0.001.
Figure 4
Figure 4. Injection of exogenously desialylated platelets stimulates hepatic TPO mRNA expression, TPO release and platelet production in mice
(a) Survival of fluorescently labeled WT platelets treated (open symbol) or not (closed symbol) with sialidase injected into WT (full black line) or Asgr2−/− (dashed blue line) mice. Insert: Terminal β-galactose exposure was evaluated in untreated (black, −sia) and sialidase-treated (red, +sia) WT platelets by flow cytometry using RCA-I lectin. (b) Liver TPO mRNA expression, (c) plasma TPO levels, (d) blood platelet counts of WT (full line) and Asgr2−/− (dashed line) mice injected with WT platelets treated (open symbols) or not (closed symbols) with sialidase. (e) BMMK numbers were measured 3 days after injection. (f) Representative bone marrow sections stained with hematoxylin and eosin. BMMK numbers. Data are mean ± SD of 6 WT and 4 Asgr2−/− recipients. *P<0.05. Sialidase injections. (g) Blood platelet counts, (h) liver TPO mRNA expression, (i) plasma TPO levels, and (j) BMMK numbers in WT and Asgr2−/− mice injected or not with sialidase. BMMK numbers were measured 3 days after injection. Data are mean ± SD of 5 mice. *P<0.05, **P<0.01.
Figure 5
Figure 5. Antibody-mediated thrombocytopenia does not stimulate liver TPO mRNA expression
(a) Blood platelet counts, (b) liver TPO mRNA expression, (c) plasma TPO levels and (d) BMMK numbers in WT (black circle), Asgr2−/− (blue square) and St3gal4−/− (green rhombus) mice injected with a rabbit anti-mouse platelet serum (RAMPS). Bone marrow megakaryocyte numbers were measured 3 days after RAMPS injection. Data are mean ± SD of 5 mice. *P<0.05, **P<0.01, ***P<0.001.

Similar articles

Cited by

References

    1. Kaushansky K. The molecular mechanisms that control thrombopoiesis. J Clin Invest. 2005;115:3339–3347. doi: 10.1172/JCI26674. - DOI - PMC - PubMed
    1. Kaushansky K. Determinants of platelet number and regulation of thrombopoiesis. Hematology Am Soc Hematol Educ Program. 2009:147–152. doi: 10.1182/asheducation-2009.1.147. - DOI - PubMed
    1. Kuter DJ. Thrombopoietin and thrombopoietin mimetics in the treatment of thrombocytopenia. Annu Rev Med. 2009;60:193–206. - PubMed
    1. Kuter DJ, Rosenberg RD. The reciprocal relationship of thrombopoietin (Mpl ligand) to changes in the platelet mass during busulfan-induced thrombocytopenia in the rabbit. Blood. 1995;85:2720–2730. - PubMed
    1. Cohen-Solal K, et al. Constitutive expression of Mpl ligand transcripts during thrombocytopenia or thrombocytosis. Blood. 1996;88:2578–2528. - PubMed

Publication types

MeSH terms