. 2015 Apr 2;20(1):720-8.
doi: 10.2119/molmed.2014.00140.

An entity evolving into a community: defining the common ancestor and evolutionary trajectory of chronic lymphocytic leukemia stereotyped subset #4

Affiliations

An entity evolving into a community: defining the common ancestor and evolutionary trajectory of chronic lymphocytic leukemia stereotyped subset #4

Lesley-Ann Sutton et al. Mol Med. .

Abstract

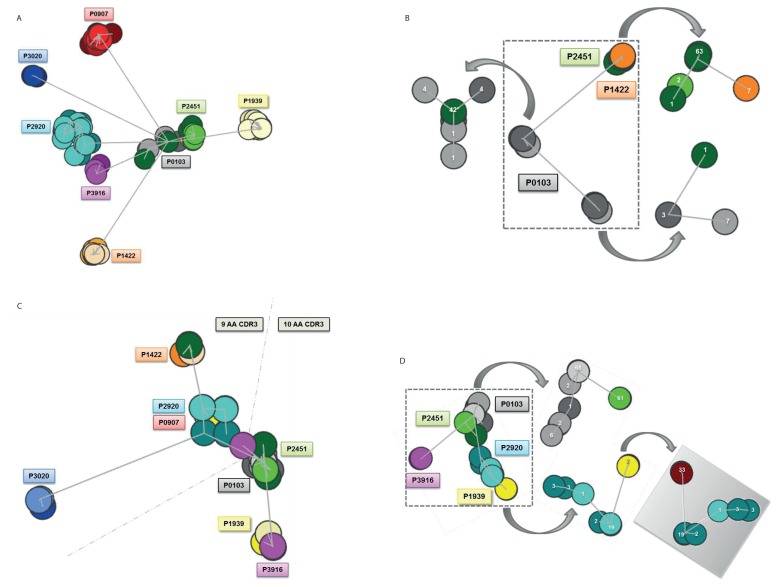
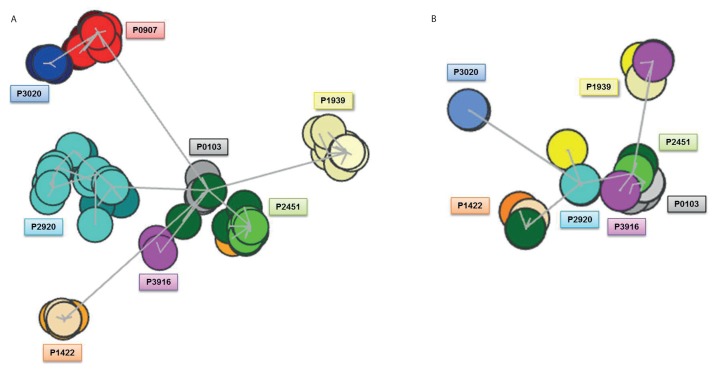
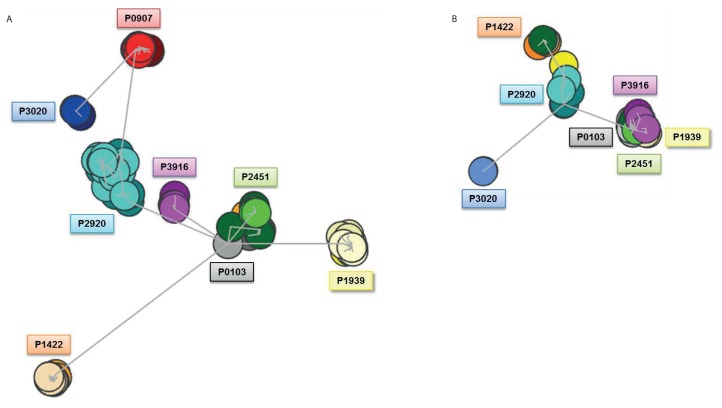
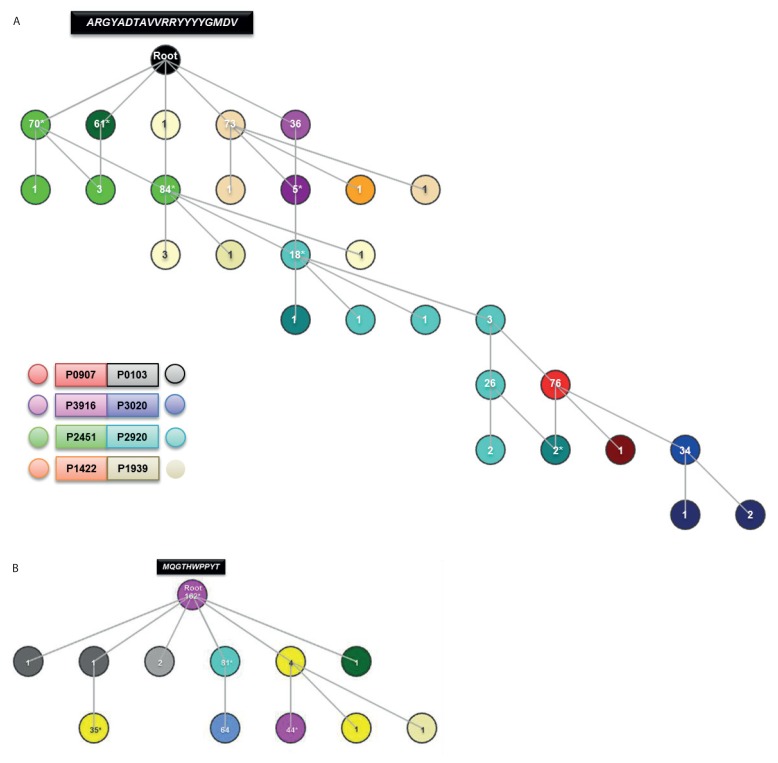
Patients with chronic lymphocytic leukemia (CLL) assigned to stereotyped subset #4 express highly homologous B-cell receptor immunoglobulin (BcR IG) sequences with intense intraclonal diversification (ID) in the context of ongoing somatic hypermutation (SHM). Their remarkable biological and clinical similarities strongly support derivation from a common ancestor. We here revisited ID in subset #4 CLL to reconstruct their evolutionary history as a community of related clones. To this end, using specialized bioinformatics tools we assessed both IGHV-IGHD-IGHJ rearrangements (n = 511) and IGKV-IGKJ rearrangements (n = 397) derived from eight subset #4 cases. Due to high sequence relatedness, a number of subclonal clusters from different cases lay very close to one another, forming a core from which clusters exhibiting greater variation stemmed. Minor subclones from individual cases were mutated to such an extent that they now resembled the sequences of another patient. Viewing the entire subset #4 data set as a single entity branching through diversification enabled inference of a common sequence representing the putative ancestral BcR IG expressed by their still elusive common progenitor. These results have implications for improved understanding of the ontogeny of CLL subset #4, as well as the design of studies concerning the antigenic specificity of the clonotypic BcR IGs.


Figures

Figure 1
Figure 1
Composite clusters of subset #4 IG sequences at the amino acid level. Figure 1A illustrates cluster formation following analysis of the IGHV–IGHD–IGHJ amino acid sequences (n = 511). Six distinct clusters were observed: a central core was created by clonal sequences from two patients, P0103 and P2451, and from this core radiated a further five clusters. Figure 1B provides a more detailed view of the composition of this central core. The central core is framed by dotted lines and each cluster is then dissected further. The seven sequences from P1422 segregated from the parent cluster were observed initially at diagnosis as a minor subclone, were represented by only a single subcloned sequence at the second time point (1/33 subcloned sequences; 3%) and were undetectable at the third time point. Figure 1C details cluster formation following analysis of the IGKV–IGKJ amino acid sequences (n = 397). Figure 1D provides a more complete view of the major cluster resulting from analysis of the IGKV–IGKJ subclonal sequences. The major cluster is surrounded by dotted lines, and a comprehensive breakdown of each cluster is provided. As observed with the IG heavy chain sequences, we noted that individual IG kappa sequences occasionally were separated from their respective clusters, and instead attached to distant clusters. This was particularly noted for three clonal sequences, one from P1939 and two from P2451, which carried 9-amino acid VK CDR3s while their remaining clonal sequences all carried a 10-amino acid VK CDR3; the longer VK CDR3 is created by an additional proline at codon 115 and an equal proportion of subset #4 cases in this study carried either a 9-amino acid VK CDR3 or a 10-amino acid VK CDR3. During cluster formation, patients with identical sequences become hidden by the last patient to be analyzed and found to harbor the exact same sequence. Thus, while it may initially appear that P0907 is absent from the clustering analysis in Figure 1C, it is merely obscured by another patient. This is illustrated in the reverse image of the P1939 (yellow)/P2920 (blue) cluster provided in Figure 1D, with the subclonal sequences of P0907 indicated by the red circle. Each circle represents subcloned sequences from one of the eight subset #4 patients included in the study. Identical sequences overlap and are thus represented by a single circle. Circles are color coded to match the patient tag and different shades of the same color indicate subclonal sequences from the same patient but from a different time point. The number within each circle indicates how many sequences carried that specific rearrangement. In Figure 1C, subcloned sequences with a 9-amino acid VK CDR3 lie above the dashed gray line while subclonal sequences from patients with a 10-amino acid VK CDR3 lie below the line. The number of circles appearing for each case is related to the level of intraclonal diversification observed. The asterisk beside the number 42 in Figure 1B indicates that this circle represents sequences from more than one patient.
Figure 2
Figure 2
Cluster formation when considering amino acids within the same physicochemical groups as equals. Figure 2A illustrates clustering of the IG heavy chains (n = 511) while figure 2B concerns clustering of the IG kappa light chains (n = 397). When considering amino acids within the same physicochemical groups (as defined by IMGT) as equals, a new cluster was formed at the heavy chain level between P3020 and P0907 (previously represented by two distinct clusters) while the effect on IG kappa light chains was minor and predominantly related to the separation of P2920 and P0907 from the central cluster. Circles are color coded to match the patient tag and different shades of the same color indicate subclonal sequences from the same patient but from a different time point. The number of circles appearing for each case is related to the level of ID observed.
Figure 3
Figure 3
Composite clusters of subset #4 IG sequences at the nucleotide level. Figure 3A illustrates cluster formation following analysis of the IGHV–IGHD–IGHJ nucleotide sequences (n = 511). Seven distinct clusters were observed; six clusters represented a single patient each, while P0103 and P2451 remained clustered together, thus accounting for the seventh cluster. Figure 3B highlights cluster formation following analysis of the IGKV–IGKJ nucleotide sequences (n = 397) and highlights the distancing of the two central cores and instead the formation of a major cluster containing the subcloned sequences of four patients (P0103, P2451, P3916 and P1939). Circles are color coded to match the patient tag and different shades of the same color indicate subclonal sequences from the same patient but from a different time point. The number of circles appearing for each case is related to the level of intraclonal diversification observed.
Figure 4
Figure 4
Molecular phylogeny of the VH and VK CDR3 sequences of subset #4. Figure 4A illustrates how hierarchical visualization of the VH CDR3 amino acid sequence from all patients facilitated the construction of a VH CDR3 sequence that can now be considered as the root from which all subset #4 VH CDR3 sequences are derived. Since no patient’s VH CDR3 sequence exactly matched the derived root, they are visually placed as branches. Sequences that have an equal number of amino acid changes from the root are placed at the same level (within the same row), since they branch from the root in a similar manner. Figure 4B illustrates the above phenomena for the VK CDR3 amino acid sequences. The limited branching evidenced is indicative of sequence relatedness, with only one or two differences between any patient sequence and the derived root. Identical sequences overlap and are thus represented by a single circle. The asterisk indicates that this circle represents sequences from more than one case. The number within each circle indicates how many sequences carried that specific rearrangement.

Similar articles

Cited by

References

    1. Stamatopoulos K, et al. Over 20% of patients with chronic lymphocytic leukemia carry stereotyped receptors: Pathogenetic implications and clinical correlations. Blood. 2007;109:259–70. - PubMed
    1. Baliakas P, et al. Clinical effect of stereotyped B-cell receptor immunoglobulins in chronic lymphocytic leukaemia: a retrospective multicentre study. Lancet Haematol. 2014;1:e74–84. - PubMed
    1. Murray F, et al. Stereotyped patterns of somatic hypermutation in subsets of patients with chronic lymphocytic leukemia: implications for the role of antigen selection in leukemogenesis. Blood. 2008;111:1524–33. - PubMed
    1. Agathangelidis A, et al. Stereotyped B-cell receptors in one-third of chronic lymphocytic leukemia: a molecular classification with implications for targeted therapies. Blood. 2012;119:4467–75. - PMC - PubMed
    1. Vardi A, et al. IgG-switched CLL has a distinct immunogenetic signature from the common MD variant: ontogenetic implications. Clin Cancer Res. 2014;20:323–30. - PubMed

Publication types

Substances

LinkOut - more resources