

Replication-dependent histone genes are actively transcribed in differentiating and aging retinal neurons
- PMID: 25486194
- PMCID: PMC4614993
- DOI: 10.4161/15384101.2015.941757
Replication-dependent histone genes are actively transcribed in differentiating and aging retinal neurons
Abstract
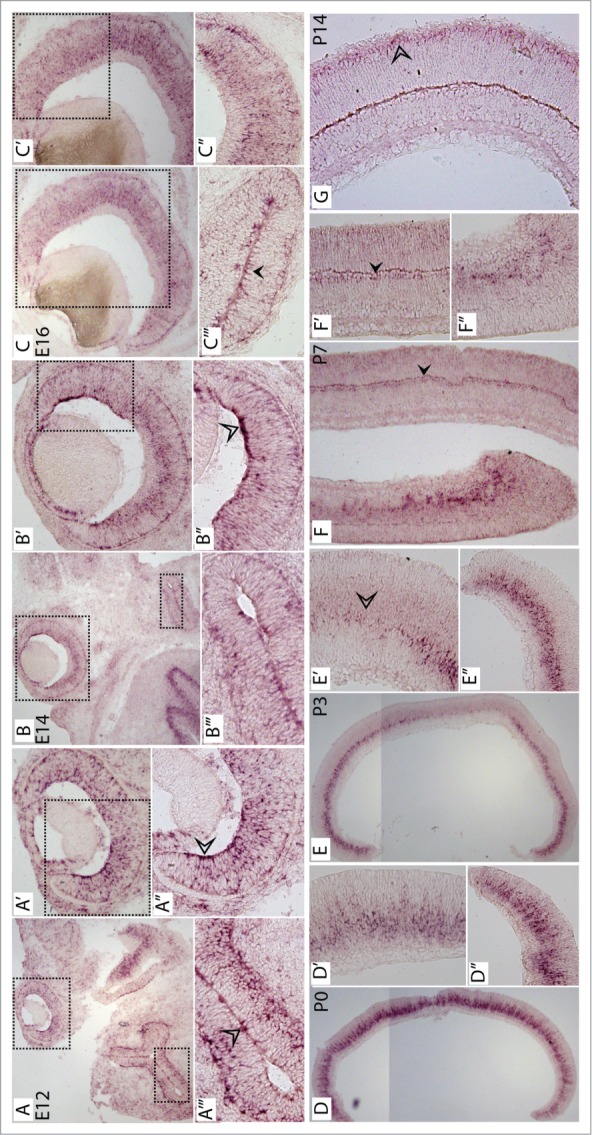
In the mammalian genome, each histone family contains multiple replication-dependent paralogs, which are found in clusters where their transcription is thought to be coupled to the cell cycle. Here, we wanted to interrogate the transcriptional regulation of these paralogs during retinal development and aging. We employed deep sequencing, quantitative PCR, in situ hybridization (ISH), and microarray analysis, which revealed that replication-dependent histone genes were not only transcribed in progenitor cells but also in differentiating neurons. Specifically, by ISH analysis we found that different histone genes were actively transcribed in a subset of neurons between postnatal day 7 and 14. Interestingly, within a histone family, not all paralogs were transcribed at the same level during retinal development. For example, expression of Hist1h1b was higher embryonically, while that of Hist1h1c was higher postnatally. Finally, expression of replication-dependent histone genes was also observed in the aging retina. Moreover, transcription of replication-dependent histones was independent of rapamycin-mediated mTOR pathway inactivation. Overall, our data suggest the existence of variant nucleosomes produced by the differential expression of the replication-dependent histone genes across retinal development. Also, the expression of a subset of replication-dependent histone isotypes in senescent neurons warrants re-examining these genes as "replication-dependent." Thus, our findings underscore the importance of understanding the transcriptional regulation of replication-dependent histone genes in the maintenance and functioning of neurons.
Keywords: AA; CE; Chr; GCL; INL; ISH; NE; ONBL; ONL; PCR; RPE; amino acid; chromosome; cytoplasmic extract; development; expression; ganglion cell layer; histones; in situ hybridization; inner nuclear layer; isotypes; nuclear extract; outer neuroblastic layer; outer nuclear layer; polymerase chain reaction; qPCR; quantitative PCR; replication-dependent; retina; retinal pigment epithelium; transcription; variant nucleosome.
Figures


Similar articles
-
Expression patterns of dscam and sdk gene paralogs in developing zebrafish retina.Mol Vis. 2018 Jul 19;24:443-458. eCollection 2018. Mol Vis. 2018. PMID: 30078982 Free PMC article.
-
Minor splicing snRNAs are enriched in the developing mouse CNS and are crucial for survival of differentiating retinal neurons.Dev Neurobiol. 2015 Sep;75(9):895-907. doi: 10.1002/dneu.22257. Epub 2014 Dec 19. Dev Neurobiol. 2015. PMID: 25492806
-
Loss of citron kinase affects a subset of progenitor cells that alters late but not early neurogenesis in the developing rat retina.Invest Ophthalmol Vis Sci. 2015 Jan 15;56(2):787-98. doi: 10.1167/iovs.14-15272. Invest Ophthalmol Vis Sci. 2015. PMID: 25593024 Free PMC article.
-
Replication-dependent histone isoforms: a new source of complexity in chromatin structure and function.Nucleic Acids Res. 2018 Sep 28;46(17):8665-8678. doi: 10.1093/nar/gky768. Nucleic Acids Res. 2018. PMID: 30165676 Free PMC article. Review.
-
Emerging novel roles of neuropeptide Y in the retina: from neuromodulation to neuroprotection.Prog Neurobiol. 2014 Jan;112:70-9. doi: 10.1016/j.pneurobio.2013.10.002. Epub 2013 Oct 30. Prog Neurobiol. 2014. PMID: 24184719 Review.
Cited by
-
MeCP2 and the enigmatic organization of brain chromatin. Implications for depression and cocaine addiction.Clin Epigenetics. 2016 May 21;8:58. doi: 10.1186/s13148-016-0214-5. eCollection 2016. Clin Epigenetics. 2016. PMID: 27213019 Free PMC article. Review.
-
Network-based bioinformatics analysis of spatio-temporal RNA-Seq data reveals transcriptional programs underpinning normal and aberrant retinal development.BMC Genomics. 2016 Aug 31;17 Suppl 5(Suppl 5):495. doi: 10.1186/s12864-016-2822-z. BMC Genomics. 2016. PMID: 27586787 Free PMC article.
-
Glial swip-10 controls systemic mitochondrial function, oxidative stress, and neuronal viability via copper ion homeostasis.Proc Natl Acad Sci U S A. 2024 Sep 24;121(39):e2320611121. doi: 10.1073/pnas.2320611121. Epub 2024 Sep 17. Proc Natl Acad Sci U S A. 2024. PMID: 39288174 Free PMC article.
-
Protein Turnover in Epithelial Cells and Mucus along the Gastrointestinal Tract Is Coordinated by the Spatial Location and Microbiota.Cell Rep. 2020 Jan 28;30(4):1077-1087.e3. doi: 10.1016/j.celrep.2019.12.068. Epub 2020 Jan 28. Cell Rep. 2020. PMID: 31995731 Free PMC article.
-
Impact of Aging on the Phenotype of Invariant Natural Killer T Cells in Mouse Thymus.Front Immunol. 2020 Oct 30;11:575764. doi: 10.3389/fimmu.2020.575764. eCollection 2020. Front Immunol. 2020. PMID: 33193368 Free PMC article.
References
-
- Ohno S. Evolution by Gene Duplication. Berlin, New York: Springer-Verlag; 1970
-
- Jia Y, Mu JC, Ackerman SL. Mutation of a U2 snRNA gene causes global disruption of alternative splicing and neurodegeneration. Cell 2012; 148:296–308; PMID: 22265417; http://dx.doi.org/10.1016/j.cell.2011.11.057 - DOI - PMC - PubMed
-
- Marzluff WF, Gongidi P, Woods KR, Jin J, Maltais LJ. The human and mouse replication-dependent histone genes. Genomics 2002; 80:487–98; PMID: 12408966; http://dx.doi.org/10.1006/geno.2002.6850 - DOI - PubMed
-
- Chen M, Licon K, Otsuka R, Pillus L, Ideker T. Decoupling epigenetic and genetic effects through systematic analysis of gene position. Cell Rep 2013; 3:128–37. PMID: 23291096; http://dx.doi.org/10.1016/j.celrep.2012.12.003 - DOI - PMC - PubMed
-
- Wu RS, Kohn KW, Bonner WM. Metabolism of ubiquitinated histones. J Biol Chem 1981; 256:5916–20; PMID: 6263895 - PubMed
Publication types
MeSH terms
Substances
Grants and funding
LinkOut - more resources
Full Text Sources
Other Literature Sources
Miscellaneous