

BRCA1 as a nicotinamide adenine dinucleotide (NAD)-dependent metabolic switch in ovarian cancer
- PMID: 25486197
- PMCID: PMC4614796
- DOI: 10.4161/15384101.2015.942208
BRCA1 as a nicotinamide adenine dinucleotide (NAD)-dependent metabolic switch in ovarian cancer
Abstract
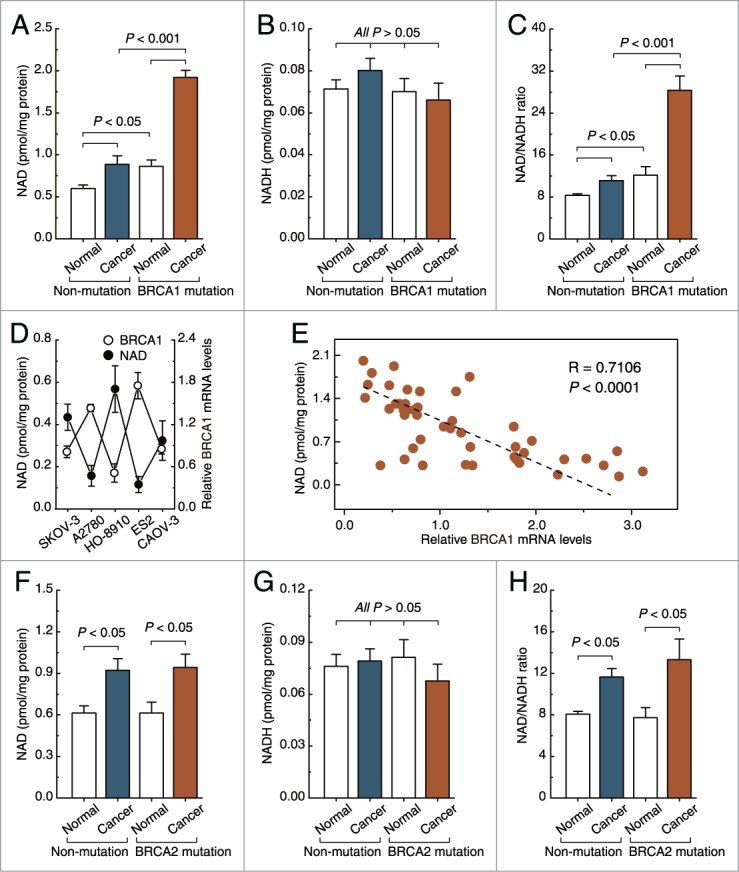
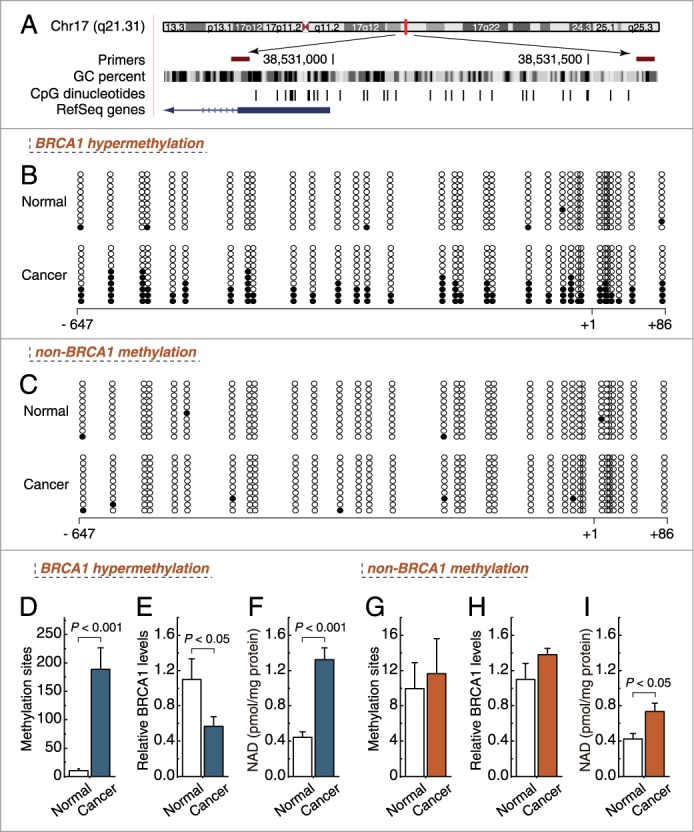
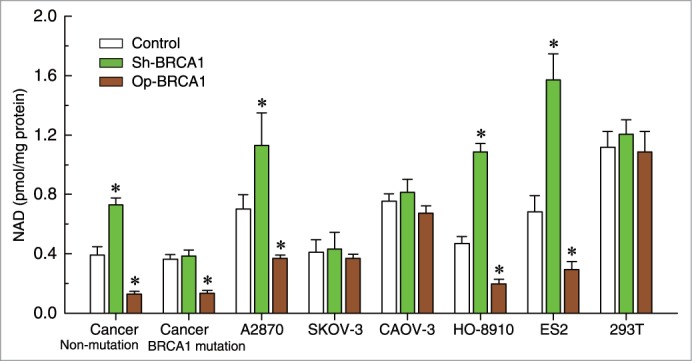
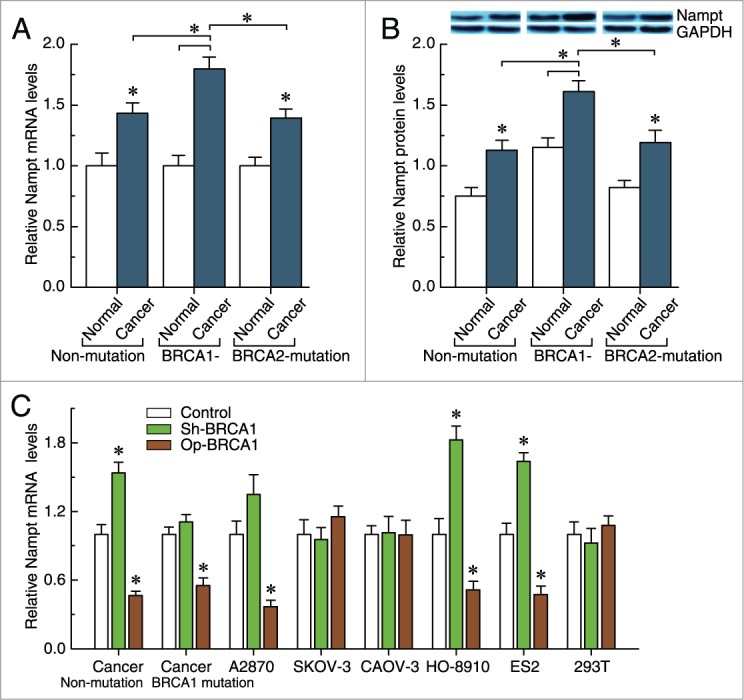
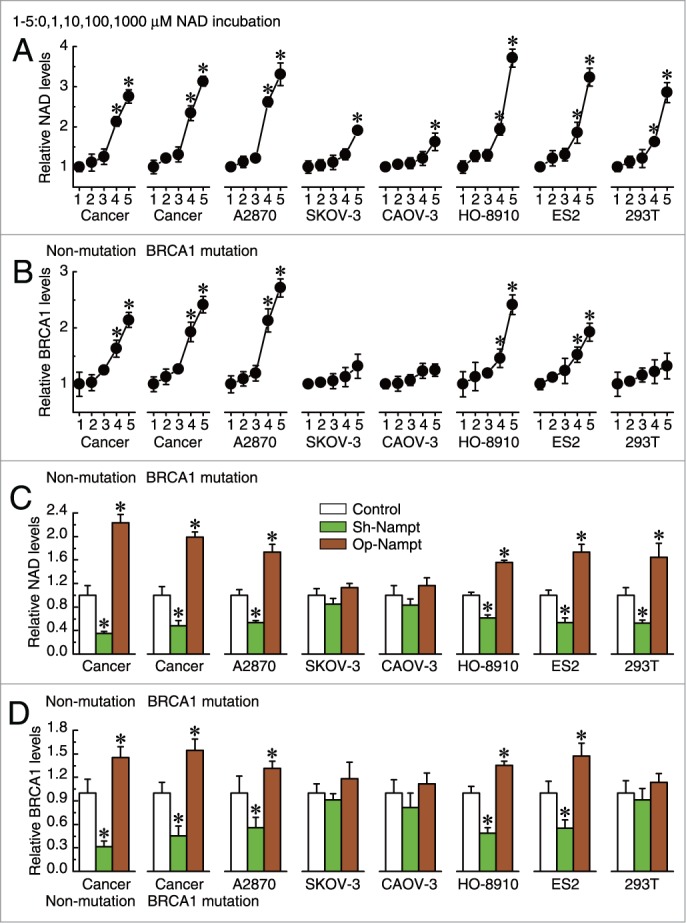
Both hereditary factors (e.g., BRCA1) and nicotinamide adenine dinucleotide (NAD)-dependent metabolic pathways are implicated in the initiation and progression of ovarian cancer. However, whether crosstalk exists between BRCA1 and NAD metabolism remains largely unknown. Here, we showed that: (i) BRCA1 inactivation events (mutation and promoter methylation) were accompanied by elevated levels of NAD; (ii) the knockdown or overexpression of BRCA1 was an effective way to induce an increase or decrease of nicotinamide phosphoribosyltransferase (Nampt)-related NAD synthesis, respectively; and (iii) BRCA1 expression patterns were inversely correlated with NAD levels in human ovarian cancer specimens. In addition, it is worth noting that: (i) NAD incubation induced increased levels of BRCA1 in a concentration-dependent manner; (ii) Nampt knockdown-mediated reduction in NAD levels was effective at inhibiting BRCA1 expression; and (iii) the overexpression of Nampt led to higher NAD levels and a subsequent increase in BRCA1 levels in primary ovarian cancer cells and A2780, HO-8910 and ES2 ovarian cancer cell lines. These results highlight a novel link between BRCA1 and NAD. Our findings imply that genetic (e.g., BRCA1 inactivation) and NAD-dependent metabolic pathways are jointly involved in the malignant progression of ovarian cancer.
Keywords: BRCA1; BRCA1, breast cancer type 1 susceptibility protein; CtBP, C-terminal binding proteins; NAD; NAD, nicotinamide adenine dinucleotide; Nampt, nicotinamide phosphoribosyltransferase; NADH; Nampt; PCR, polymerase chain reaction; ovarian cancer; shRNAs, short hairpin ribonucleic acids.
Figures
Similar articles
-
A novel crosstalk between BRCA1 and poly (ADP-ribose) polymerase 1 in breast cancer.Cell Cycle. 2014;13(21):3442-9. doi: 10.4161/15384101.2014.956507. Cell Cycle. 2014. PMID: 25485588 Free PMC article.
-
A novel crosstalk between BRCA1 and sirtuin 1 in ovarian cancer.Sci Rep. 2014 Oct 17;4:6666. doi: 10.1038/srep06666. Sci Rep. 2014. PMID: 25323003 Free PMC article.
-
Divergent metabolic responses dictate vulnerability to NAMPT inhibition in ovarian cancer.FEBS Lett. 2020 May;594(9):1379-1388. doi: 10.1002/1873-3468.13736. Epub 2020 Jan 26. FEBS Lett. 2020. PMID: 31950503
-
Nicotinamide phosphoribosyltransferase (Nampt) in carcinogenesis: new clinical opportunities.Expert Rev Anticancer Ther. 2016 Aug;16(8):827-38. doi: 10.1080/14737140.2016.1190649. Epub 2016 Jul 5. Expert Rev Anticancer Ther. 2016. PMID: 27186719 Review.
-
Nicotinamide adenine dinucleotide (NAD+): essential redox metabolite, co-substrate and an anti-cancer and anti-ageing therapeutic target.Biochem Soc Trans. 2020 Jun 30;48(3):733-744. doi: 10.1042/BST20190033. Biochem Soc Trans. 2020. PMID: 32573651 Review.
Cited by
-
Supplementation with NAD+ and its precursors: A rescue of female reproductive diseases.Biochem Biophys Rep. 2024 Apr 23;38:101715. doi: 10.1016/j.bbrep.2024.101715. eCollection 2024 Jul. Biochem Biophys Rep. 2024. PMID: 38698835 Free PMC article. Review.
-
Environmentally relevant exposure to dibutyl phthalate disrupts DNA damage repair gene expression in the mouse ovary†.Biol Reprod. 2019 Oct 25;101(4):854-867. doi: 10.1093/biolre/ioz122. Biol Reprod. 2019. PMID: 31318015 Free PMC article.
-
Effect of the BRCA1-SIRT1-EGFR axis on cisplatin sensitivity in ovarian cancer.Am J Transl Res. 2016 Mar 15;8(3):1601-8. eCollection 2016. Am J Transl Res. 2016. PMID: 27186285 Free PMC article.
-
Plasma Metabolome Signature Indicative of BRCA1 Germline Status Independent of Cancer Incidence.Front Oncol. 2021 Apr 7;11:627217. doi: 10.3389/fonc.2021.627217. eCollection 2021. Front Oncol. 2021. PMID: 33898308 Free PMC article.
-
Beyond Energy Metabolism: Exploiting the Additional Roles of NAMPT for Cancer Therapy.Front Oncol. 2020 Jan 17;9:1514. doi: 10.3389/fonc.2019.01514. eCollection 2019. Front Oncol. 2020. PMID: 32010616 Free PMC article. Review.
References
-
- Lech A, Daneva T, Pashova S, Gagov H, Crayton R, Kukwa W, Czarnecka AM, Szczylik C. Ovarian cancer as a genetic disease. Front Biosci 2013; 18:543–63; http://dx.doi.org/10.2741/4119 - DOI - PubMed
-
- Pruthi S, Gostout BS, Lindor NM. Identification and management of women with BRCA mutations or hereditary predisposition for breast and ovarian cancer. Mayo Clin Proc 2010; 85:1111–20; PMID: 21123638; http://dx.doi.org/10.4065/mcp.2010.0414 - DOI - PMC - PubMed
-
- Schouten LJ, van Dijk BA, Lumey LH, Goldbohm RA, van den Brandt PA. Energy restriction during childhood and early adulthood and ovarian cancer risk. PLoS One 2011; 6:e27960; PMID: 22132180; http://dx.doi.org/10.1371/journal.pone.0027960 - DOI - PMC - PubMed
-
- Dacheux E, Vincent A, Nazaret N, Combet C, Wierinckx A, Mazoyer S, Diaz JJ, Lachuer J, Venezia ND. BRCA1-dependent translational regulation in breast cancer cells. PLoS One 2013; 8:e67313; PMID: 23805307; http://dx.doi.org/10.1371/journal.pone.0067313 - DOI - PMC - PubMed
-
- Li D, Bi FF, Cao JM, Cao C, Li CY, Yang Q. Effect of BRCA1 on epidermal growth factor receptor in ovarian cancer. J Exp Clin Cancer Res 2013; 32:102; PMID: 24321281; http://dx.doi.org/10.1186/1756-9966-32-102 - DOI - PMC - PubMed
Publication types
MeSH terms
Substances
LinkOut - more resources
Full Text Sources
Other Literature Sources
Medical
Miscellaneous