. 2014 Dec 8;9(12):e114702.
doi: 10.1371/journal.pone.0114702. eCollection 2014.

Descriptive epidemiology of typhoid fever during an epidemic in Harare, Zimbabwe, 2012

Affiliations

Descriptive epidemiology of typhoid fever during an epidemic in Harare, Zimbabwe, 2012

Jonathan A Polonsky et al. PLoS One. .

Abstract

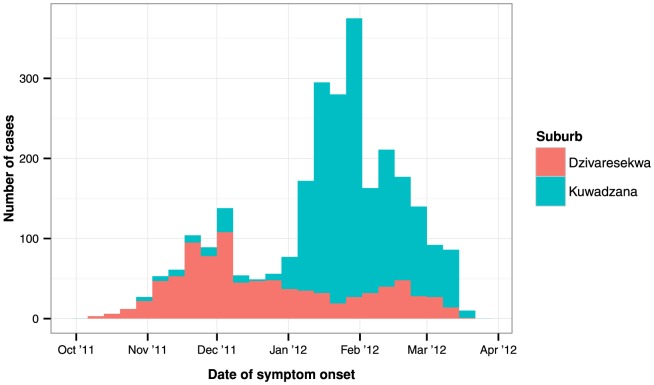
Background: Typhoid fever remains a significant public health problem in developing countries. In October 2011, a typhoid fever epidemic was declared in Harare, Zimbabwe - the fourth enteric infection epidemic since 2008. To orient control activities, we described the epidemiology and spatiotemporal clustering of the epidemic in Dzivaresekwa and Kuwadzana, the two most affected suburbs of Harare.

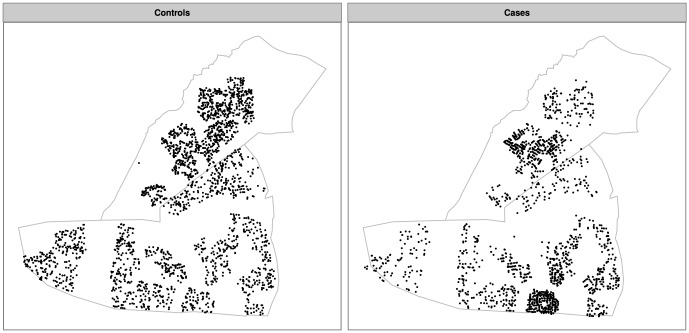
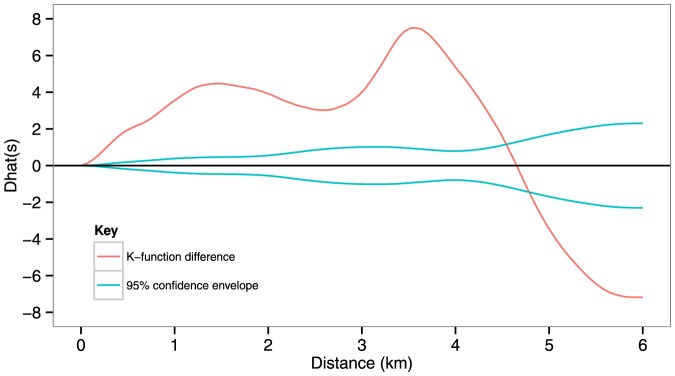
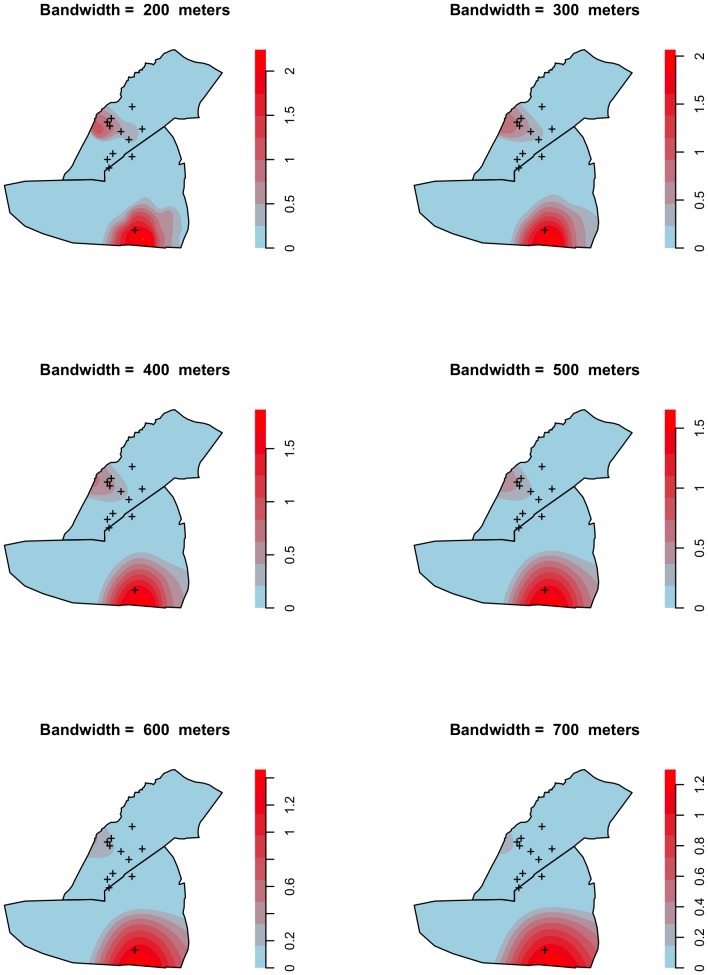
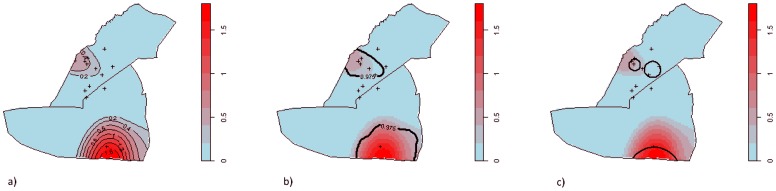
Methods: A typhoid fever case-patient register was analysed to describe the epidemic. To explore clustering, we constructed a dataset comprising GPS coordinates of case-patient residences and randomly sampled residential locations (spatial controls). The scale and significance of clustering was explored with Ripley K functions. Cluster locations were determined by a random labelling technique and confirmed using Kulldorff's spatial scan statistic.

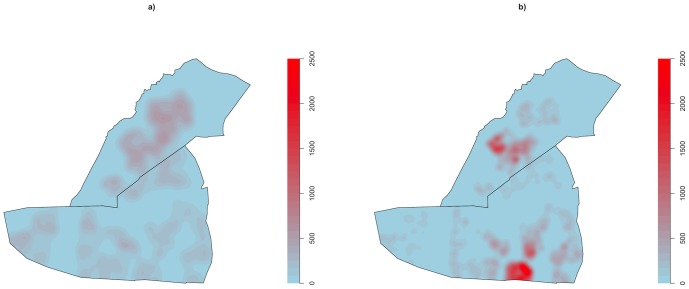
Principal findings: We analysed data from 2570 confirmed and suspected case-patients, and found significant spatiotemporal clustering of typhoid fever in two non-overlapping areas, which appeared to be linked to environmental sources. Peak relative risk was more than six times greater than in areas lying outside the cluster ranges. Clusters were identified in similar geographical ranges by both random labelling and Kulldorff's spatial scan statistic. The spatial scale at which typhoid fever clustered was highly localised, with significant clustering at distances up to 4.5 km and peak levels at approximately 3.5 km. The epicentre of infection transmission shifted from one cluster to the other during the course of the epidemic.

Conclusions: This study demonstrated highly localised clustering of typhoid fever during an epidemic in an urban African setting, and highlights the importance of spatiotemporal analysis for making timely decisions about targetting prevention and control activities and reinforcing treatment during epidemics. This approach should be integrated into existing surveillance systems to facilitate early detection of epidemics and identify their spatial range.


Conflict of interest statement

Competing Interests: The authors have declared that no competing interests exist.

Figures

Figure 1
Figure 1. Weekly number of suspected cases of typhoid fever, by date of symptom onset, registered in Harare, 10 October 2011–17 March 2012.
Figure 2
Figure 2. Geographical distribution of control points (representing the distribution of residential areas) and of suspected cases of typhoid fever in Dzivaresekwa and Kuwadzana suburbs, Harare, Zimbabwe, 10 October 2011–17 March 2012.
Figure 3
Figure 3. Intensities of a) control points (representing the distribution of residential areas) and of b) suspected cases of typhoid fever, measured as events per km2, in Dzivaresekwa and Kuwadzana suburbs, Harare, Zimbabwe, 10 October 2011–17 March 2012.
Figure 4
Figure 4. Differences of K functions (red line) and 95% confidence envelope (blue lines) between suspected cases of typhoid fever and controls in Dzivaresekwa and Kuwadzana suburbs in Harare, Zimbabwe, 10 October 2011–17 March 2012.
Figure 5
Figure 5. Geographical distribution of the log relative risk of typhoid fever in Dzivaresekwa and Kuwadzana suburbs in Harare, Zimbabwe, October 10 2011–March 17 2012, according to different bandwidths used for calculating the kernel function.
Figure 6
Figure 6. Geographical distribution of the log relative risk (bandwidth  = 429 meters) of typhoid fever in Dzivaresekwa and Kuwadzana suburbs in Harare, Zimbabwe, October 10 2011–March 17 2012, with: a) contours of risk gradients; b) location of clusters identified by random labelling; c) location of clusters identified by Kulldorff's spatial scan technique.
The graphs are showing areas with increased risk of typhoid fever (log relative risk over 0), all areas with log relative risk equal or under 0 are represented in blue.

References

    1. Crump JA, Luby SP, Mintz ED (2004) The global burden of typhoid fever. Bull World Health Organ 82:346–353. - PMC - PubMed
    1. Bhan MK, Bahl R, Bhatnagar S (2005) Typhoid and paratyphoid fever. Lancet 366:749–762. - PubMed
    1. Crump JA, Mintz ED (2010) Global trends in typhoid and paratyphoid Fever. Clin Infect Dis 50:241–246. - PMC - PubMed
    1. Buckle GC, Walker CLF, Black RE (2012) Typhoid fever and paratyphoid fever: Systematic review to estimate global morbidity and mortality for 2010. J Glob Health 2:10401 10.7189/jogh.02.010401 - DOI - PMC - PubMed
    1. Parry CM, Tran TH, Dougan G, White NJ, Farrar JJ (2002) Typhoid fever. N Engl J Med 347:1770–1782. - PubMed

LinkOut - more resources