. 2014;13(17):2707-22.
doi: 10.4161/15384101.2015.945823.

CD151 represses mammary gland development by maintaining the niches of progenitor cells

Affiliations

CD151 represses mammary gland development by maintaining the niches of progenitor cells

Yuanqin Yin et al. Cell Cycle. 2014.

Abstract

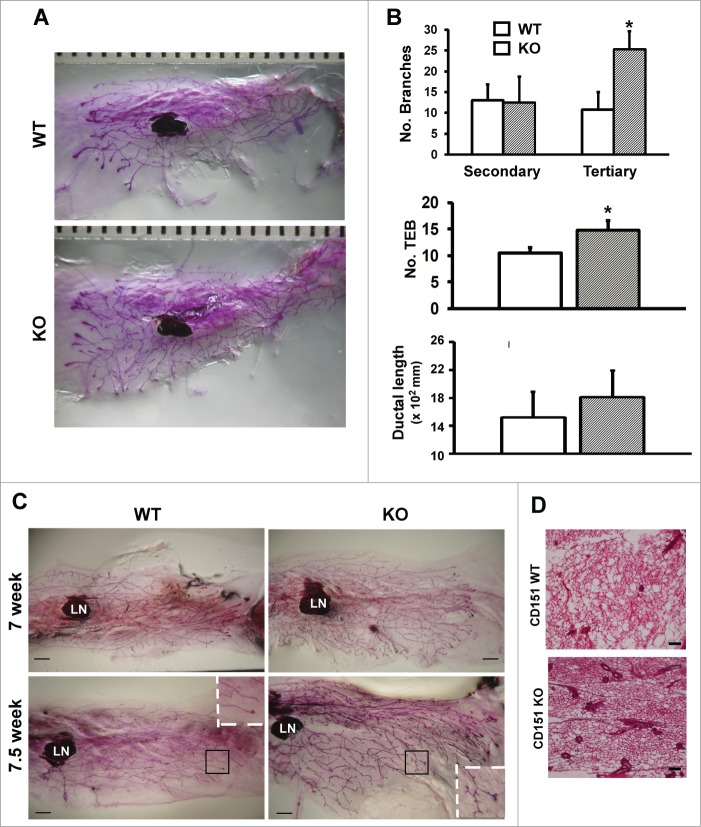
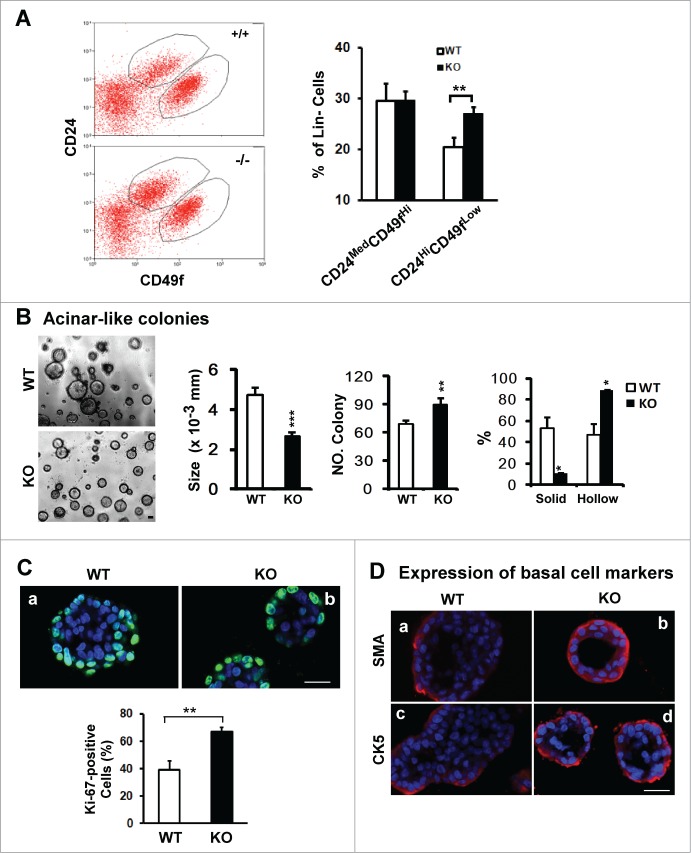
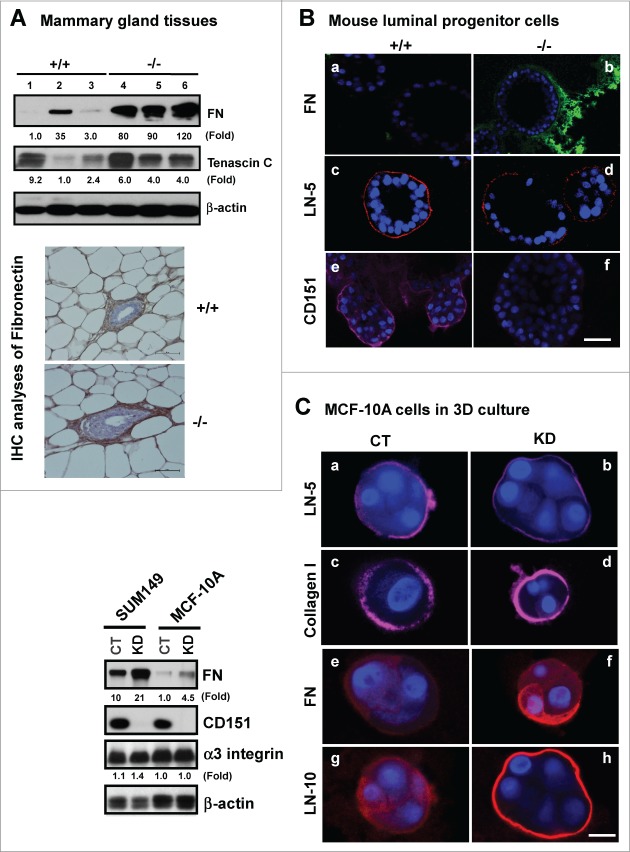
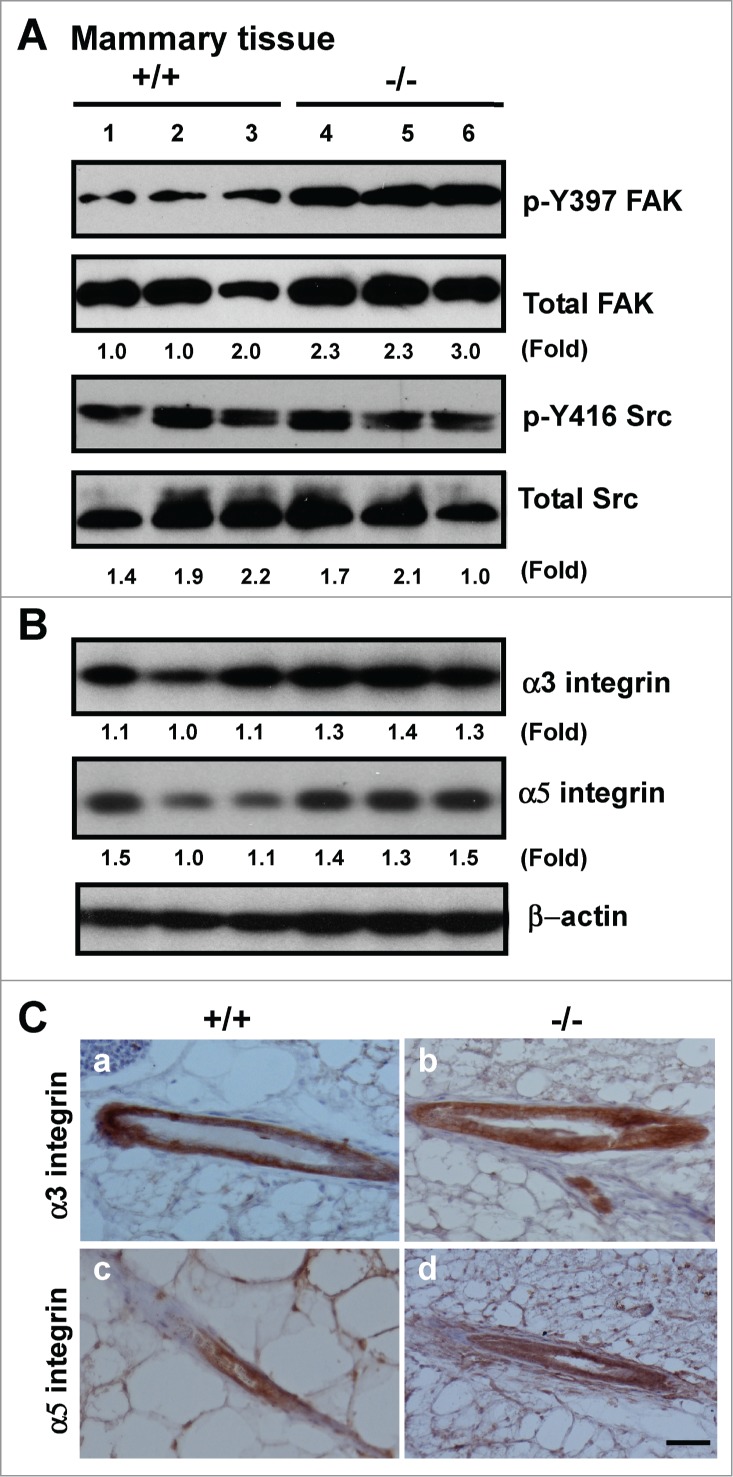
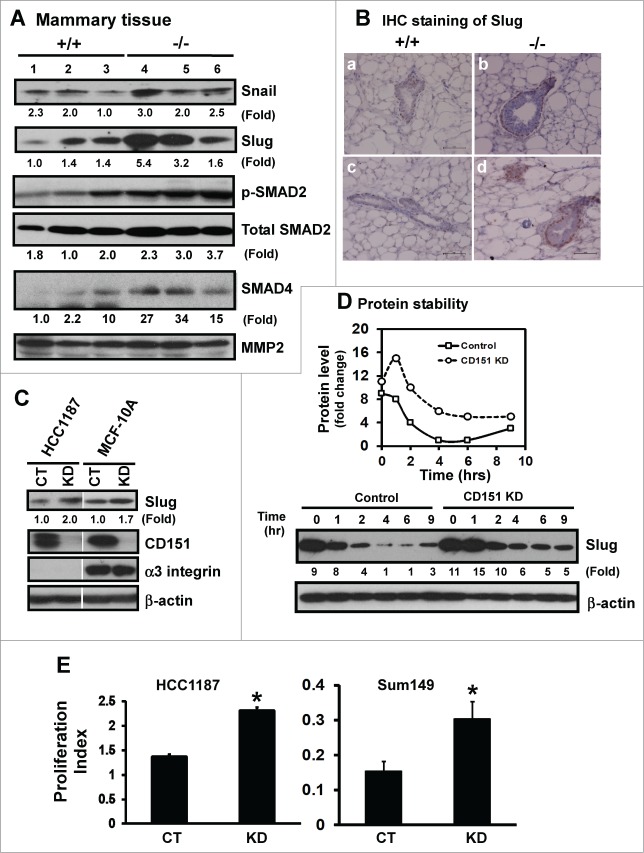
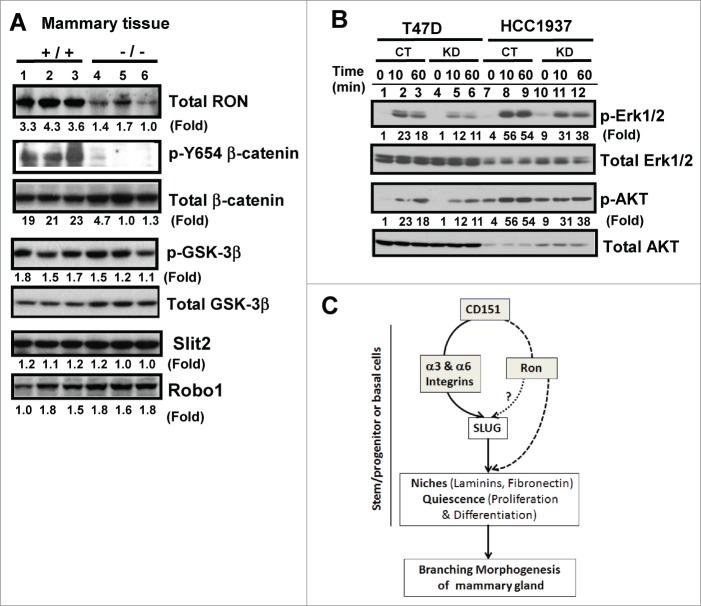
Tetraspanin CD151 interacts with laminin-binding integrins (i.e., α3β1, α6β1 and α6β4) and other cell surface molecules to control diverse cellular and physiological processes, ranging from cell adhesion, migration and survival to tissue architecture and homeostasis. Here, we report a novel role of CD151 in maintaining the branching morphogenesis and activity of progenitor cells during the pubertal development of mammary glands. In contrast to the disruption of laminin-binding integrins, CD151 removal in mice enhanced the tertiary branching in mammary glands by 2.4-fold and the number of terminal end buds (TEBs) by 30%, while having minimal influence on either primary or secondary ductal branching. Consistent with these morphological changes are the skewed distribution of basal/myoepithelial cells and a 3.2-fold increase in proliferating Ki67-positive cells. These novel observations suggest that CD151 impacts the branching morphogenesis of mammary glands by upregulating the activities of bipotent progenitor cells. Indeed, our subsequent analyses indicate that upon CD151 removal the proportion of CD24(Hi)CD49f(Low) progenitor cells in the mammary gland increased by 34%, and their proliferating and differentiating activities were significantly upregulated. Importantly, fibronectin, a pro-branching extracellular matrix (ECM) protein deposited underlying mammary epithelial or progenitor cells, increased by >7.2-fold. Moreover, there was a concomitant increase in the expression and nuclear distribution of Slug, a transcription factor implicated in the maintenance of mammary progenitor cell activities. Taken together, our studies demonstrate that integrin-associated CD151 represses mammary branching morphogenesis by controlling progenitor cell activities, ECM integrity and transcription program.

Keywords: CD151 tetraspanin; ECM, extracellular matrix; EMT, epithelial-mesenchymal transition; LB, laminin-binding; Slug; TEB, terminal end bud; extracellular matrix; integrin; mammary gland.


Figures

Figure 1.
Figure 1.
(A) Role of CD151 in the branching morphogenesis of mammary glands in mice. (A) Representative images of whole-mounted inguinal mammary glands collected from 6 week old CD151 wild-type (WT) and knock-out (KO) female virgin mice. CD151-targeted FVB mice were used to generate mouse littermates. Scale bar: 1 mm. (B) Changes in ductal lengthand number of secondary and tertiary branches in mammary glands upon CD151 removal (values: mean ± SEM, n = 4). *: P value <0.05. (C) Representative images of whole-mounted mammary glands collected from 7 and 7.5 week old female virgin mice. Scale bar: 1 mm. (D) Typical H&E staining of mammary tissue sections from 7 week old female virgin mice. Scale bar: 500 μm. For (C and D), 2–3 mice per genotype were analyzed at each time point.
Figure 2.
Figure 2.
CD151 removal skews the distribution and proliferation of body and basal/cap or myoepithelial cells in murine mammary glands. (A) Expression of epithelial cell lineage-related genes in mammary tissues. Values indicate the relative fold changes in protein expression as determined by densitometry. Blotting for β-actin protein served as a loading control. (B) Typical IHC images of mammary tissue sections were stained with antibodies against cytokeratin 5 (CK5) or cytokeratin 14 (CK14). Staining is shown for CK5 (a-d) and CK14 (e-h) for WT (a, c, e and g) and CD151-null (b, d, f and h), respectively. (C) Representative images of IHC staining of Ki67 antigen in TEBs (a-b). Ki67 staining for WT (a) and CD151 KO mice (b). Consecutive sections of CD151-null mammary tissues were stained for Ki67 (c) and β-catenin (d), respectively. Bottom panel: Percentages of Ki67-positive cells. Values were determined by estimating the average numbers of Ki67-positive cells in 5 representative fields of stained tissue section (mean ± SEM, n = 3). *: P value <0.05. For (A–C), 7 week-old mice per genotype (n = 3) were analyzed. Scale bars for B & C: 50 μm.
Figure 3.
Figure 3.
For figure legend, see page 2713.Figure 3 (See opposite page). Effect of CD151 removal on distribution, proliferation and differentiation of luminal progenitor cells in mammary glands. (A) Left panel: Typical plots of cell subpopulations within the Lin population residing in mammary glands. Lin populations were prepared from10–14 week old FVB/Sv129 mice and then sorted on flow cytometry using a combination of FITC or APC-conjugated monoclonal antibodies against CD24 and CD49f antigens. Right panel: Average portions of CD24MedCD49fHi and CD24HiCD49fLow subpopulations within Lin populations prepared from CD151 WT and null mouse littermates (mean ± SEM, n = 3). (B) Left panel: Representative images of acinar-like colonies formed by CD24Hi CD49fLow subpopulation after 3 weeks of 3D culture. Right panel: Changes in the size, number and percentage of solid and hollow colonies (n = 5). (C and D) Staining of Ki67 or smooth muscle actin (SMA) or cytokeratin 5 (CK5) in the acinar-like colonies formed by the CD24HiCD49fLow fraction prepared from CD151 WT or KO mice. Green/Red: Antibody staining. Blue: DAPI for nuclei. Percentages of Ki67-positive cells were determined microscopically in multiple representative fields. For (B and C), values (mean ± SEM) were calculated from 3 independent experiments. For (A–C), *: P value <0 .05, **: P value <0.01. All images and measurements in (B–D) are representative of at least 3 independent experiments. Scale bars for (B–D): 50 μm.
Figure 4.
Figure 4.
For figure legend, see page 2715.Figure 4 (See opposite page). Impact of CD151 removal on the ECM expression and distribution in murine mammary glands and progenitor cells. (A) ECM proteins in murine mammary glands. Top panel: Protein analyses were performed with mammary tissues from CD151 wild-type (+/+) or null (−/−) mice (n = 3) and fold changes were indicated. Bottom panel: IHC staining of fibronectin in mammary tissues of CD151 WT and KO mice. (B) Distribution of ECM proteins surrounding acinar-like structures formed by murine mammary CD24HiCD49fLow subpopulations under 3D culture. Fibronectin (FN): a-b. laminin-332 (LN-5): c-d. CD151: e-f. Red: Antibody staining; Blue: DAPI for nuclei. CD151 WT: a, c and e; CD151 KO: b, d and f. The CD24HiCD49fLow subpopulation was prepared from 10–14 week old mice as described in Figure 3. (C) Changes in expression and distribution of ECM proteins, i.e., laminin-332 (LN-5), laminin-511 (LN-10), collagen I or fibronectin (FN) and integrins in cultured human breast epithelial cell lines (SUM-149, MCF-10A). Left panel, immunoblotting of FN, CD151, α3 integrin and β-actin in SUM-149 and MCF-10A cell lines with or without CD151 knockdown (CT, KD). Right panel, CD151 knockdown effect on ECM composition in MCF-10A cells. All IF staining of ECM molecules (red) or DAPI (blue) for nuclei were visualized and imaged under confocal microscope. Scale bars for (A–C): 50 μm.
Figure 5.
Figure 5.
Effect of CD151 deletion on integrin expression and signaling in murine mammary glands. (A and B), Lysates of mammary tissues from 3 individual mice per genotype were analyzed with antibodies against phospho-specific or total protein for FAK or Src kinases (A) or against α3 or α5 integrin (B). Fold changes in the ratio of Y397/total FAK protein or pY416/total Src or integrins were calculated on the basis of densitometry measurements. (C)Representative images of α3 and α5 integrin distribution in mouse mammary tissues. IHC analyses were conducted with rabbit polyclonal antibodies against α3 (a-b) or α5 integrin (c-d) with mammary tissues from CD151 WT (a, c) or KO mice (b, d) (n = 3). Scale bar: 50 μm.
Figure 6.
Figure 6.
For figure legend, see page 2718.Figure 6 (See previous page). Suppression of the expression and activation of transcription factor Slug and TGF-β signaling by CD151. (A) Expression of Snail and Slug proteins and TGF-β-mediated signaling in mammary tissues. Mammary tissues from 3 individual mice per genotype were blotted with the indicated antibodies. MMP-2 served as a loading control. (B) Representative images of Slug distribution in mammary glands. IHC staining was conducted with tissues from CD151 WT (a, c) or KO (b, d) mice (n = 3). Scale bar: 50 μm. (C) Changes in Slug expression in human mammary epithelial cells upon CD151 ablation. Human mammary epithelial cells (HCC-1187 and SUM-149) with (KD) or without CD151 knockdown (CT) were lysed and blotted for Slug, CD151, α3 integrin and β-actin. (D) Effect of CD151 removal on Slug protein stability. Top panel, Scatter plot of fold changes in Slug protein over time. MCF-10A cells with or without CD151 knockdown were treated with 20 μg/mL cycloheximide over the indicated periods of time and followed by lysing in RIPA buffer and blotting with indicated antibody. (E) Proliferation indices of human mammary progenitor-like epithelial cells (HCC-1187, SUM-149) with (KD) or without CD151 knockdown (CT) over 48 hr period of culture (n = 4). *: P value <0.05. (A–D): Fold changes were calculated on the basis of densitometry measurements.
Figure 7.
Figure 7.
(A) Link between CD151 and receptor tyrosine kinase Ron in mammary epithelial cells. (A) Expression of Ron, Slit2, Robo1 and related signaling molecules in mammary glands. Blotting was conducted with tissues collected from CD151 WT (+/+) and KO (−/−) mice (n =3). (B) Altered signaling of Ron kinase. Human breast carcinoma cell lines (HCC-1937 and T47D), with and without CD151 ablation, were starved and subsequently stimulated with 30 ng/mL MSP, a ligand for Ron, followed by lysing in RIPA buffer and blotting with indicated signaling antibodies. (C) A working model of CD151 function during pubertal development of mammary glands.

References

    1. Watson CJ, Khaled WT. Mammary development in the embryo and adult: a journey of morphogenesis and commitment. Development 2008; 135:995-1003; PMID: 18296651; http://dx.doi.org/10.1242/dev.005439 - DOI - PubMed
    1. Sternlicht MD. Key stages in mammary gland development - The cues that regulate ductal branching morphogenesis. Breast Cancer Res 2006; 8:201; PMID: 16524451; http://dx.doi.org/10.1186/bcr1368 - DOI - PMC - PubMed
    1. McNally S, Martin F. Molecular regulators of pubertal mammary gland development. Ann Med 2011; 43:212-34; PMID: 21417804; http://dx.doi.org/10.3109/07853890.2011.554425 - DOI - PubMed
    1. Asselin-Labat ML, Vaillant F, Shackleton M, Bouras T, Lindeman GJ, Visvader JE. Delineating the epithelial hierarchy in the mouse mammary gland. Cold Spring Harb Symp Quant Biol 2008; 73:469-78; PMID: 19022771; http://dx.doi.org/10.1101/sqb.2008.73.020 - DOI - PubMed
    1. Lu P, Takai K, Weaver VM, Werb Z. Extracellular matrix degradation and remodeling in development and disease. Cold Spring Harb Perspect Biol 2011; 3:25; PMID: 21917992; http://dx.doi.org/10.1101/cshperspect.a005058 - DOI - PMC - PubMed

Publication types

MeSH terms