

Zero-lag synchronization despite inhomogeneities in a relay system
- PMID: 25486522
- PMCID: PMC4259331
- DOI: 10.1371/journal.pone.0112688
Zero-lag synchronization despite inhomogeneities in a relay system
Abstract
A novel proposal for the zero-lag synchronization of the delayed coupled neurons, is to connect them indirectly via a third relay neuron. In this study, we develop a Poincaré map to investigate the robustness of the synchrony in such a relay system against inhomogeneity in the neurons and synaptic parameters. We show that when the inhomogeneity does not violate the symmetry of the system, synchrony is maintained and in some cases inhomogeneity enhances synchrony. On the other hand if the inhomogeneity breaks the symmetry of the system, zero lag synchrony can not be preserved. In this case we give analytical results for the phase lag of the spiking of the neurons in the stable state.
Conflict of interest statement
Figures
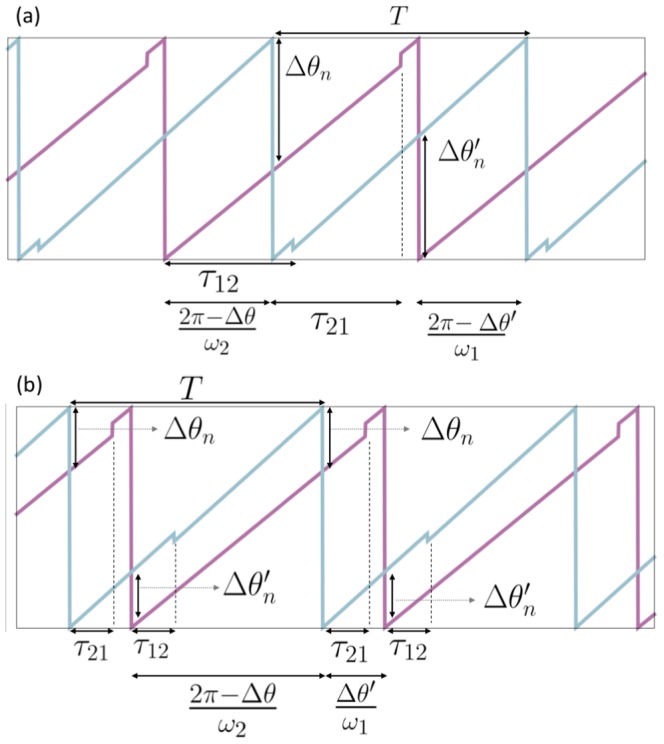
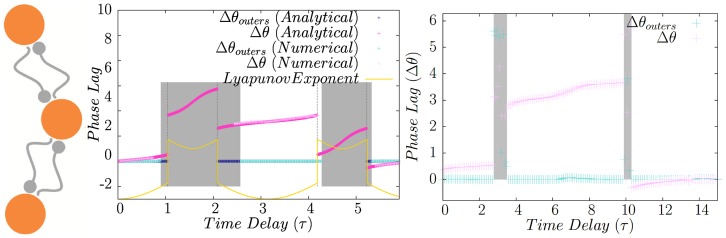
 . (b) Time evolution of two bi-directionally coupled phase oscillators for
  .
.  is the period of the oscillators in the phase-locked state and
  is the delay time from pre-synaptic neuron
  to post-synaptic neuron
  .
.  (
( ) is the phase difference (modulo
  ) of two neurons at the
  spiking time of first (second) neuron.
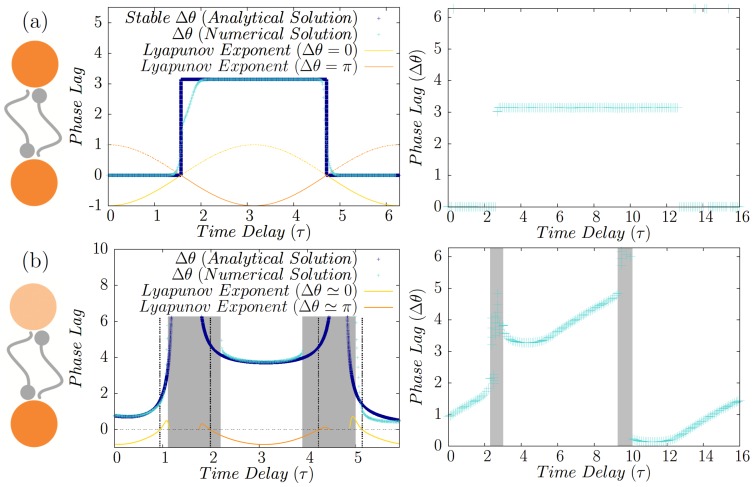
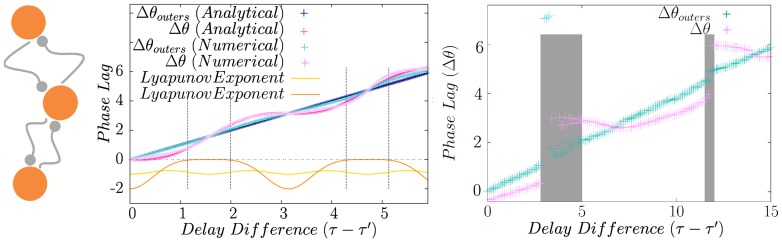
 ) of firing of two identical Hodgkin-Huxely neurons is plotted in the right panel. (b) Synchronized states of two directly coupled neurons in presence of frequency mismatch. Numerical solutions (Cyan) affirm the validity of the analytical results obtained from linear approximation (Dark Blue). Lyapunov exponent for each of the locked states are also shown. Shaded area show the regions where no 1∶1 locking mode is seen in numerical results, and the dashed gray lines are the boundary of stability of analytic solution with negative Lyapunov exponents. In the right panel the phase difference is shown for two HH neurons with different firing rates.
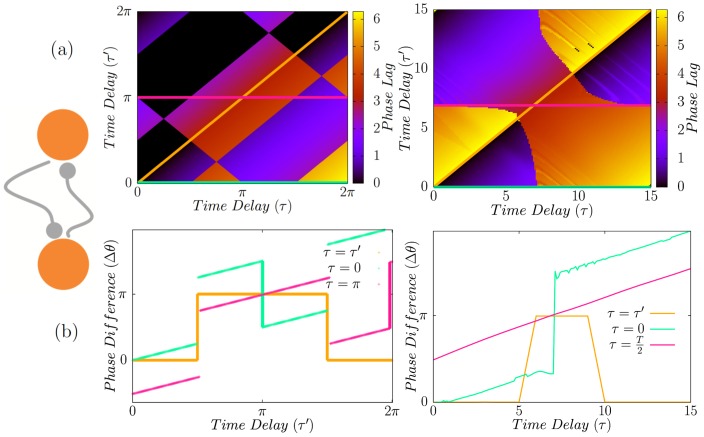
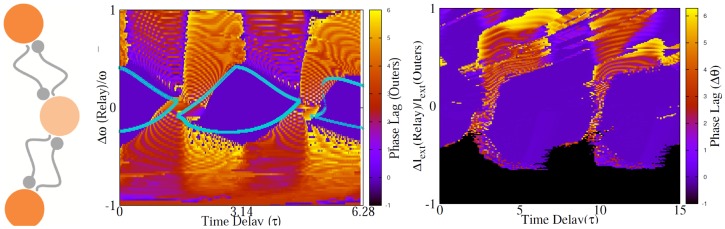
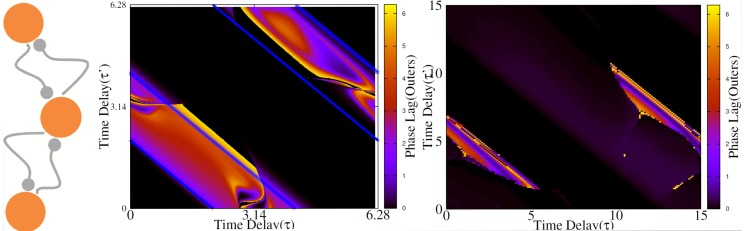
 (along diagonal in (a)) and with fixed
  (along horizontal lines in (a)). Synchrony can only been seen for homogeneous system
  . Figures in right column present the results for HH neurons. Even though the patterns are not the same, the main result still holds and synchrony can not be seen with unequal delays.
  in the bottom-right panel is the period of the firing of HH neurons in the locked state.
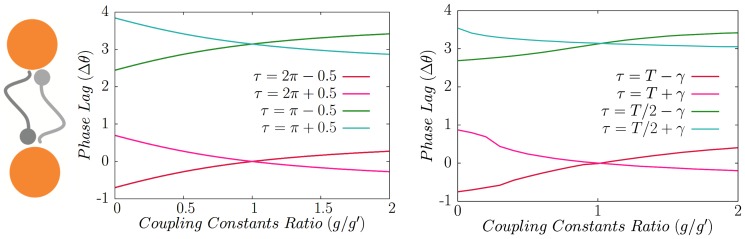
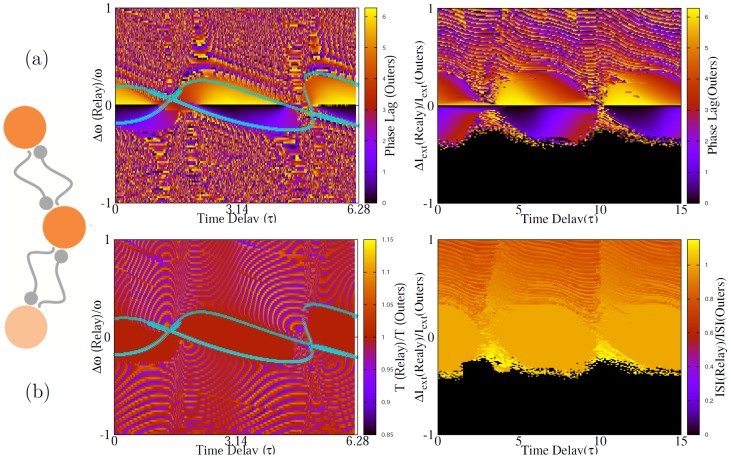
 in which homogeneous network shows different properties (inphase and antiphase) in the homogenous case. The right panel show the similar result for HH neurons. Here T stands for oscillation period of HH neurons and
  .
.
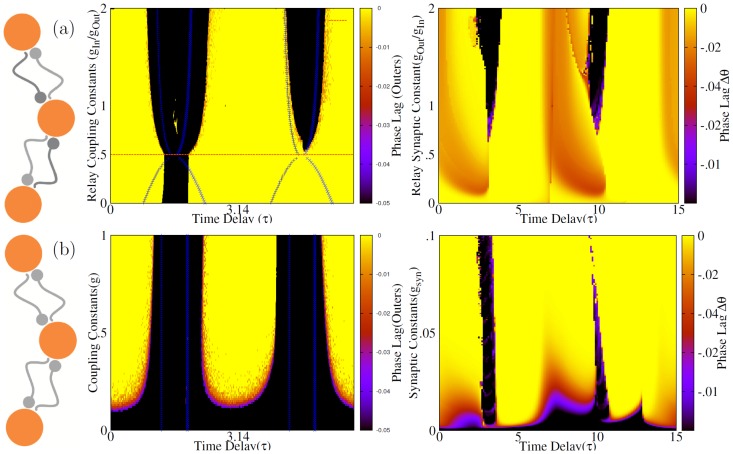
 ). Color code shows time lag of spiking of outer neurons, resulted from numerical experiments. Solid lines are drawn based on the analytic results, showing the domain of stability of synchronous state. Note that for
  synchrony is seen for almost all the values of delay time. For comparison the results for the homogeneous system are shown in (b) where all the synaptic constants are equal. In this case except for very small synaptic constants, the results are insensitive to the changes of synaptic strengths and can not results a synchronous state. Right panel show the similar results for HH neurons.
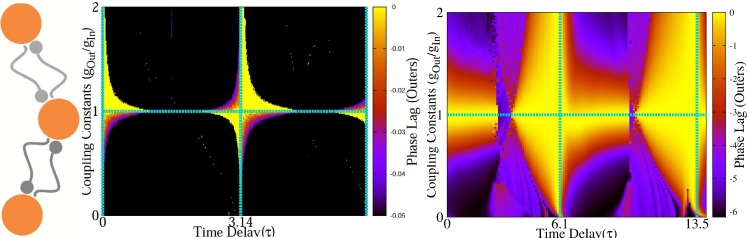
 and
and  .
.
Similar articles
-
Synchronization of delayed coupled neurons in presence of inhomogeneity.J Comput Neurosci. 2014 Feb;36(1):55-66. doi: 10.1007/s10827-013-0461-9. Epub 2013 Jun 7. J Comput Neurosci. 2014. PMID: 23744009
-
When Long-Range Zero-Lag Synchronization is Feasible in Cortical Networks.Front Comput Neurosci. 2012 Jul 27;6:49. doi: 10.3389/fncom.2012.00049. eCollection 2012. Front Comput Neurosci. 2012. PMID: 22866034 Free PMC article.
-
Effect of phase response curve skew on synchronization with and without conduction delays.Front Neural Circuits. 2013 Dec 11;7:194. doi: 10.3389/fncir.2013.00194. eCollection 2013. Front Neural Circuits. 2013. PMID: 24376399 Free PMC article.
-
Self-Organized Near-Zero-Lag Synchronization Induced by Spike-Timing Dependent Plasticity in Cortical Populations.PLoS One. 2015 Oct 16;10(10):e0140504. doi: 10.1371/journal.pone.0140504. eCollection 2015. PLoS One. 2015. PMID: 26474165 Free PMC article.
-
Distributed synchrony in a cell assembly of spiking neurons.Neural Netw. 2001 Jul-Sep;14(6-7):815-24. doi: 10.1016/s0893-6080(01)00044-2. Neural Netw. 2001. PMID: 11665773 Review.
Cited by
-
Transmission delays and frequency detuning can regulate information flow between brain regions.PLoS Comput Biol. 2021 Apr 15;17(4):e1008129. doi: 10.1371/journal.pcbi.1008129. eCollection 2021 Apr. PLoS Comput Biol. 2021. PMID: 33857135 Free PMC article.
-
Dendritic and Axonal Propagation Delays Determine Emergent Structures of Neuronal Networks with Plastic Synapses.Sci Rep. 2017 Jan 3;7:39682. doi: 10.1038/srep39682. Sci Rep. 2017. PMID: 28045109 Free PMC article.
-
Information Transmission in Delay-Coupled Neuronal Circuits in the Presence of a Relay Population.Front Syst Neurosci. 2021 Jul 29;15:705371. doi: 10.3389/fnsys.2021.705371. eCollection 2021. Front Syst Neurosci. 2021. PMID: 34393731 Free PMC article.
-
Stimulus-dependent synchronization in delayed-coupled neuronal networks.Sci Rep. 2016 Mar 22;6:23471. doi: 10.1038/srep23471. Sci Rep. 2016. PMID: 27001428 Free PMC article.
-
Synchronization of delayed coupled neurons with multiple synaptic connections.Cogn Neurodyn. 2024 Apr;18(2):631-643. doi: 10.1007/s11571-023-10013-9. Epub 2023 Nov 10. Cogn Neurodyn. 2024. PMID: 38699603 Free PMC article.
References
-
- Murphy J, Kwan H, Wong Y (1985) Cross correlation studies in primate motor cortex: synaptic interaction and shared input. The Canadian journal of neurological sciences Le journal canadien des sciences neurologiques 12:11–23. - PubMed
-
- Gray CM, König P, Engel AK, Singer W (1989) Oscillatory responses in cat visual cortex exhibit inter-columnar synchronization which reflects global stimulus properties. Nature 338:334–337. - PubMed
-
- Vaadia E, Aertsen A (1992) Coding and computation in the cortex: single-neuron activity and cooperative phenomena. In: Information processing in the cortex, Springer. pp. 81–121.
-
- Sillito AM, Jones HE, Gerstein GL, West DC (1994) Feature-linked synchronization of thalamic relay cell firing induced by feedback from the visual cortex. Nature 369:479–482. - PubMed
-
- Riehle A, Grün S, Diesmann M, Aertsen A (1997) Spike synchronization and rate modulation differentially involved in motor cortical function. Science 278:1950–1953. - PubMed
MeSH terms
LinkOut - more resources
Full Text Sources
Other Literature Sources
