

The transcription factor p53: not a repressor, solely an activator
- PMID: 25486564
- PMCID: PMC4612452
- DOI: 10.4161/15384101.2014.949083
The transcription factor p53: not a repressor, solely an activator
Abstract
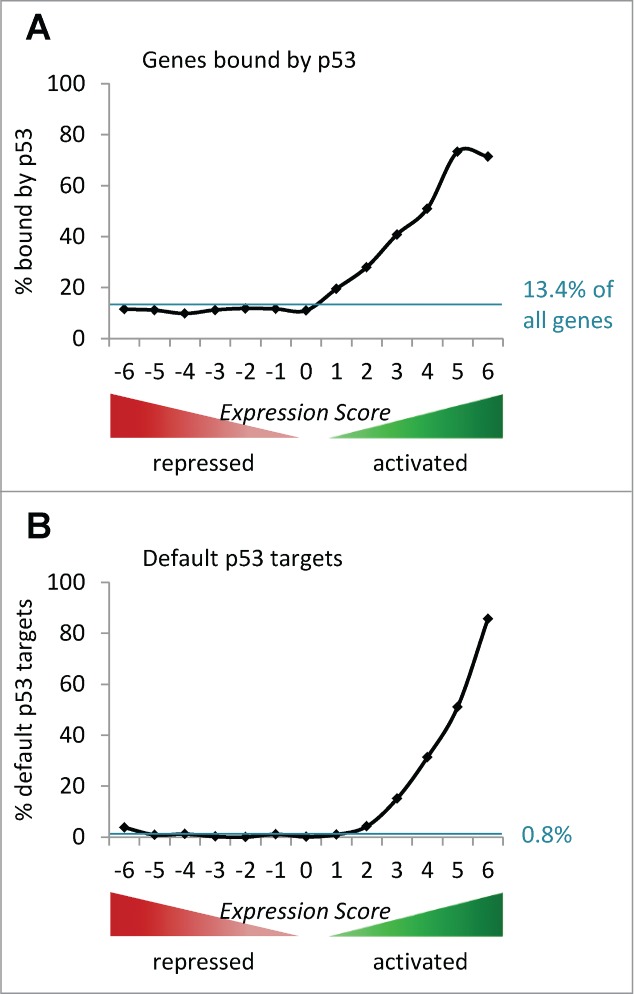
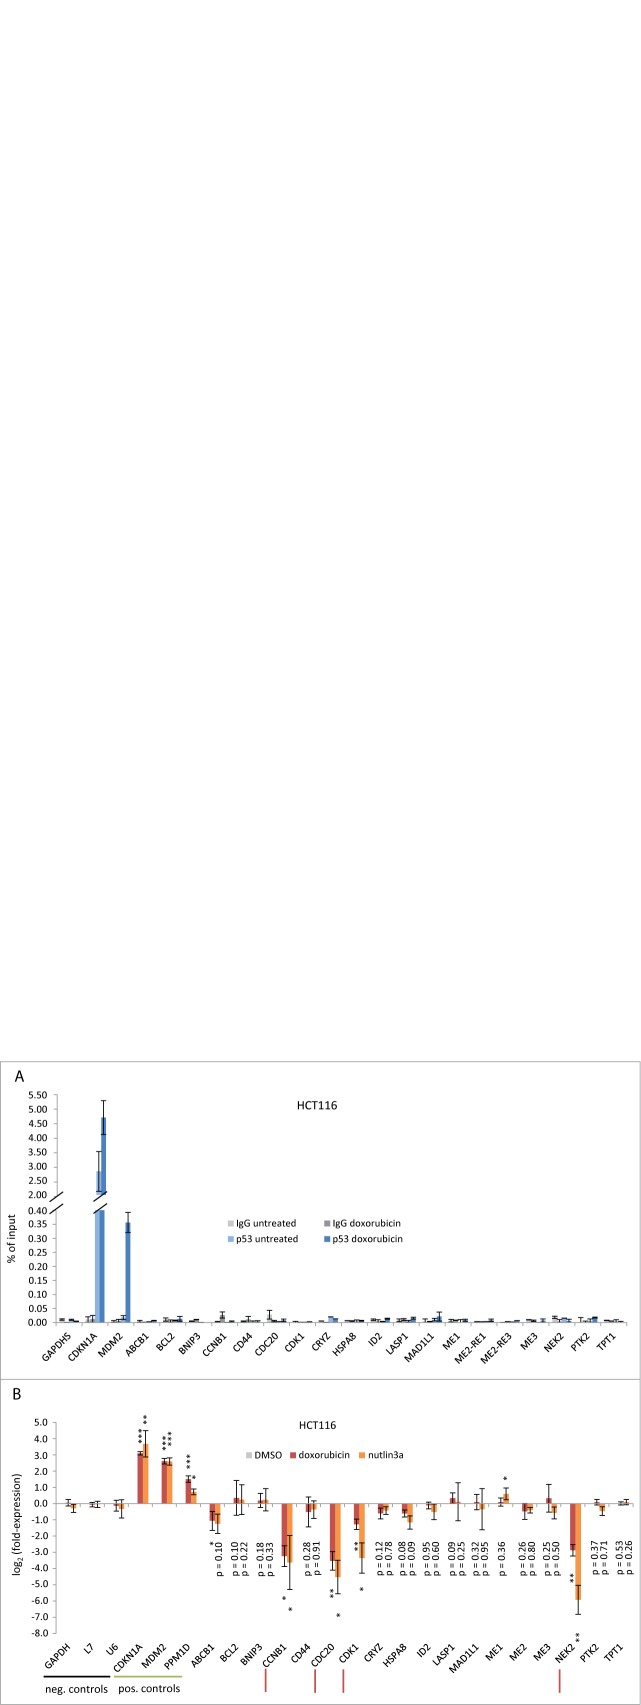
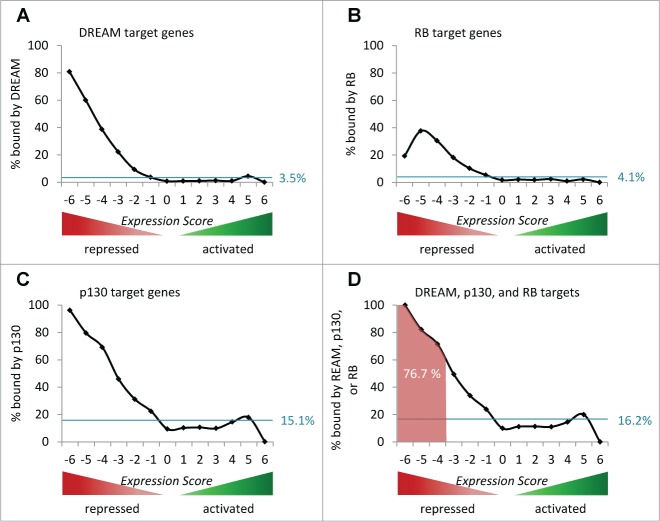
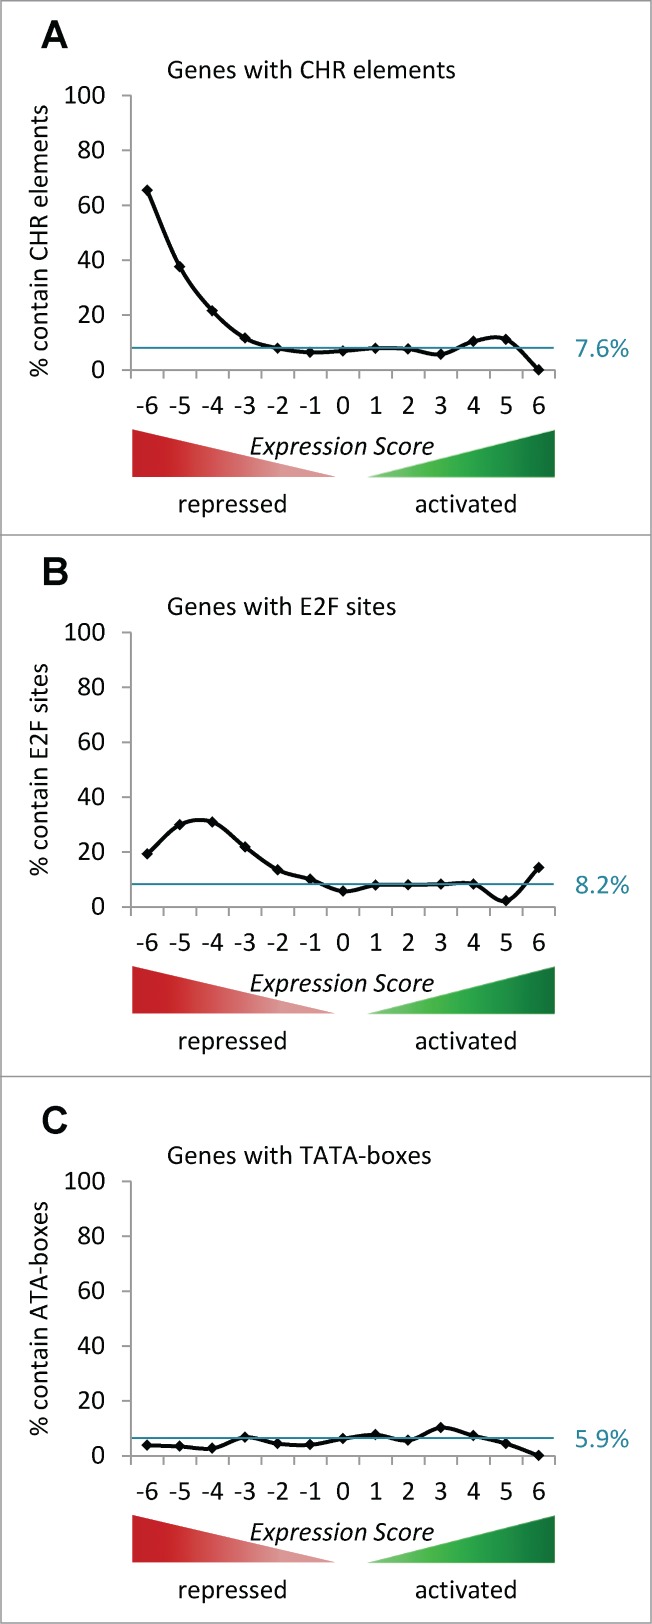
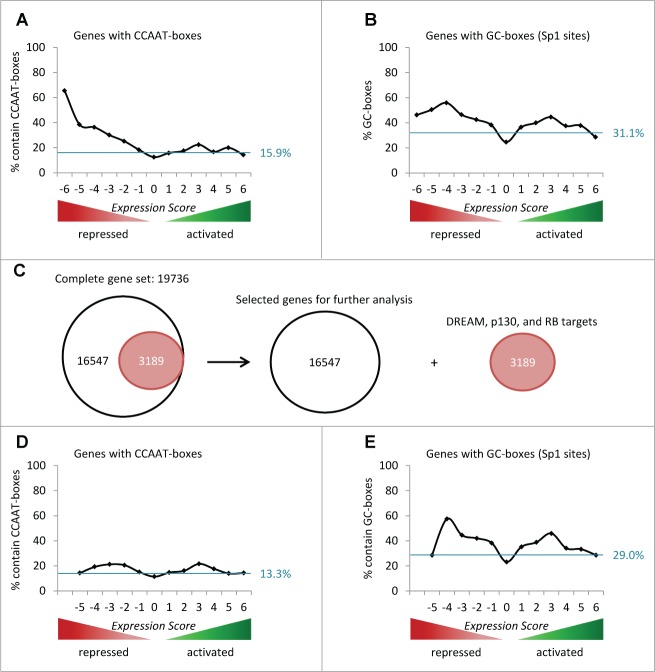
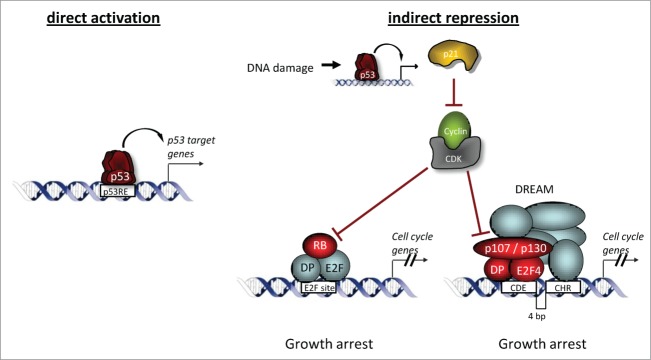
The predominant function of the tumor suppressor p53 is transcriptional regulation. It is generally accepted that p53-dependent transcriptional activation occurs by binding to a specific recognition site in promoters of target genes. Additionally, several models for p53-dependent transcriptional repression have been postulated. Here, we evaluate these models based on a computational meta-analysis of genome-wide data. Surprisingly, several major models of p53-dependent gene regulation are implausible. Meta-analysis of large-scale data is unable to confirm reports on directly repressed p53 target genes and falsifies models of direct repression. This notion is supported by experimental re-analysis of representative genes reported as directly repressed by p53. Therefore, p53 is not a direct repressor of transcription, but solely activates its target genes. Moreover, models based on interference of p53 with activating transcription factors as well as models based on the function of ncRNAs are also not supported by the meta-analysis. As an alternative to models of direct repression, the meta-analysis leads to the conclusion that p53 represses transcription indirectly by activation of the p53-p21-DREAM/RB pathway.
Keywords: CDE, cell cycle-dependent element; CDKN1A; CHR, cell cycle genes homology region; ChIP, chromatin immunoprecipitation; DREAM complex; DREAM, DP, RB-like, E2F4, and MuvB complex; E2F/RB complex; HPV, human papilloma virus; NF-Y, Nuclear factor Y; cdk, cyclin-dependent kinase; genome-wide meta-analysis; p53.
Figures
Similar articles
-
Indirect p53-dependent transcriptional repression of Survivin, CDC25C, and PLK1 genes requires the cyclin-dependent kinase inhibitor p21/CDKN1A and CDE/CHR promoter sites binding the DREAM complex.Oncotarget. 2015 Dec 8;6(39):41402-17. doi: 10.18632/oncotarget.6356. Oncotarget. 2015. PMID: 26595675 Free PMC article.
-
DREAM and RB cooperate to induce gene repression and cell-cycle arrest in response to p53 activation.Nucleic Acids Res. 2019 Sep 26;47(17):9087-9103. doi: 10.1093/nar/gkz635. Nucleic Acids Res. 2019. PMID: 31400114 Free PMC article.
-
p53 can repress transcription of cell cycle genes through a p21(WAF1/CIP1)-dependent switch from MMB to DREAM protein complex binding at CHR promoter elements.Cell Cycle. 2012 Dec 15;11(24):4661-72. doi: 10.4161/cc.22917. Epub 2012 Nov 27. Cell Cycle. 2012. PMID: 23187802 Free PMC article.
-
Cell cycle regulation: p53-p21-RB signaling.Cell Death Differ. 2022 May;29(5):946-960. doi: 10.1038/s41418-022-00988-z. Epub 2022 Mar 31. Cell Death Differ. 2022. PMID: 35361964 Free PMC article. Review.
-
Cell cycle arrest through indirect transcriptional repression by p53: I have a DREAM.Cell Death Differ. 2018 Jan;25(1):114-132. doi: 10.1038/cdd.2017.172. Epub 2017 Nov 10. Cell Death Differ. 2018. PMID: 29125603 Free PMC article. Review.
Cited by
-
Retrotransposon-derived p53 binding sites enhance telomere maintenance and genome protection.Bioessays. 2016 Oct;38(10):943-9. doi: 10.1002/bies.201600078. Epub 2016 Aug 19. Bioessays. 2016. PMID: 27539745 Free PMC article. Review.
-
Targeting the Transcriptome Through Globally Acting Components.Front Genet. 2021 Sep 16;12:749850. doi: 10.3389/fgene.2021.749850. eCollection 2021. Front Genet. 2021. PMID: 34603400 Free PMC article. Review.
-
A human-specific, concerted repression of microcephaly genes contributes to radiation-induced growth defects in cortical organoids.iScience. 2025 Jan 20;28(2):111853. doi: 10.1016/j.isci.2025.111853. eCollection 2025 Feb 21. iScience. 2025. PMID: 39967878 Free PMC article.
-
The puzzling regulation of the interferon signaling system by the p53 tumor suppressor protein.Cell Mol Life Sci. 2025 Jun 13;82(1):233. doi: 10.1007/s00018-025-05763-0. Cell Mol Life Sci. 2025. PMID: 40512405 Free PMC article.
-
Mechanisms of Cellular Senescence: Cell Cycle Arrest and Senescence Associated Secretory Phenotype.Front Cell Dev Biol. 2021 Mar 29;9:645593. doi: 10.3389/fcell.2021.645593. eCollection 2021. Front Cell Dev Biol. 2021. PMID: 33855023 Free PMC article. Review.
References
-
- Lane DP. Benchimol S. p53: oncogene or anti-oncogene? Genes Dev 1990; 4:1-8; PMID:2137806 - PubMed
-
- Levine AJ, Oren M. The first 30 years of p53: growing ever more complex. Nat Rev Cancer 2009; 9:749-58; http://dx.doi.org/10.1038/nrc2723; PMID:19776744 - DOI - PMC - PubMed
-
- Ko LJ, Prives C. p53: puzzle and paradigm. Genes Dev 1996; 10:1054-72; PMID:8654922 - PubMed
-
- Menendez D, Inga A, Resnick MA. The expanding universe of p53 targets. Nat Rev Cancer 2009; 9:724-37; PMID:19776742; http://dx.doi.org/10.1038/nrc2730 - DOI - PubMed
-
- Wei CL, Wu Q, Vega VB, Chiu KP, Ng P, Zhang T, Shahab A, Yong HC, Fu Y, Weng Z, et al. . A global map of p53 transcription-factor binding sites in the human genome. Cell 2006; 124:207-19; PMID:16413492 - PubMed
Publication types
MeSH terms
Substances
LinkOut - more resources
Full Text Sources
Other Literature Sources
Research Materials
Miscellaneous