

Different effects of ZO-1, ZO-2 and ZO-3 silencing on kidney collecting duct principal cell proliferation and adhesion
- PMID: 25486565
- PMCID: PMC4612710
- DOI: 10.4161/15384101.2014.949091
Different effects of ZO-1, ZO-2 and ZO-3 silencing on kidney collecting duct principal cell proliferation and adhesion
Abstract
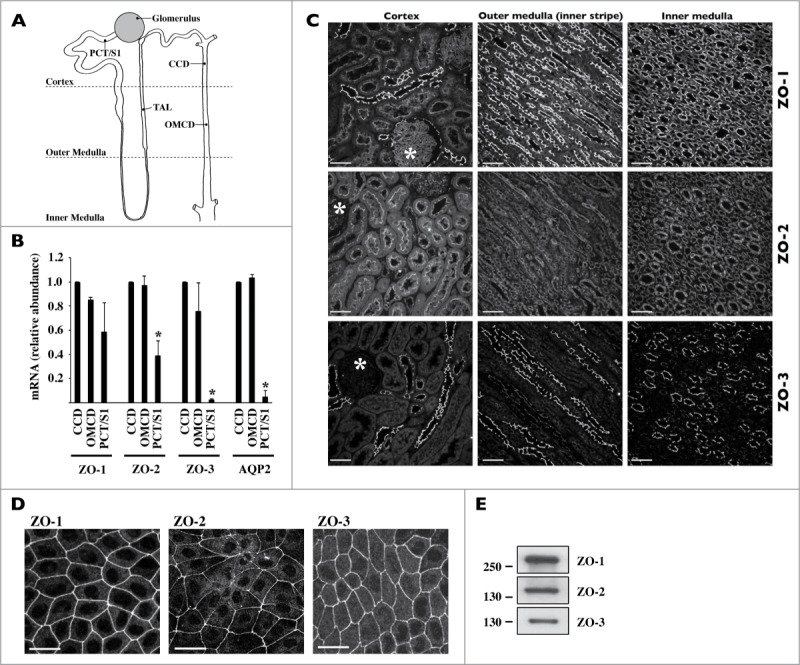
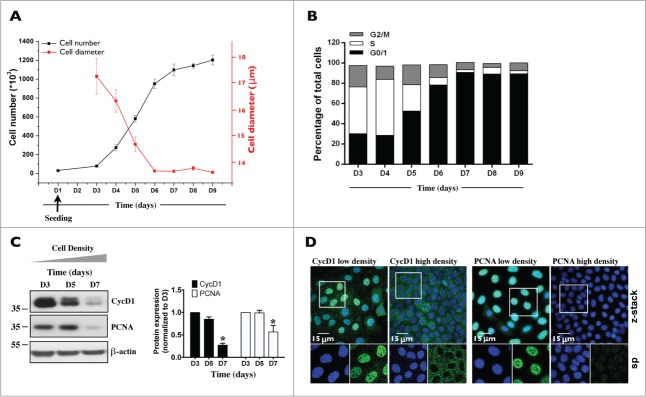
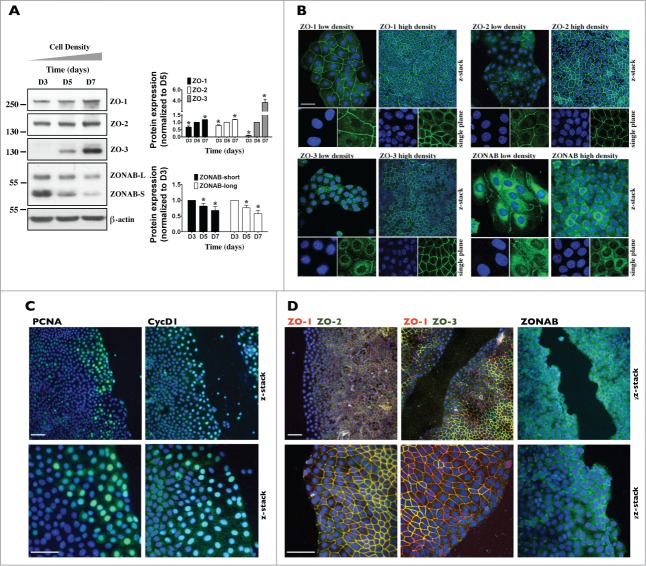
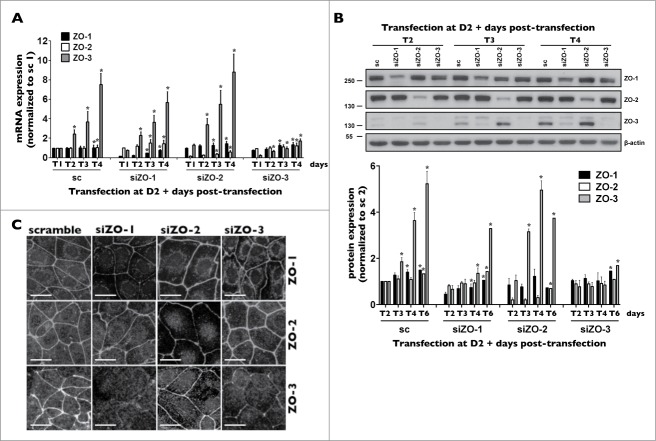
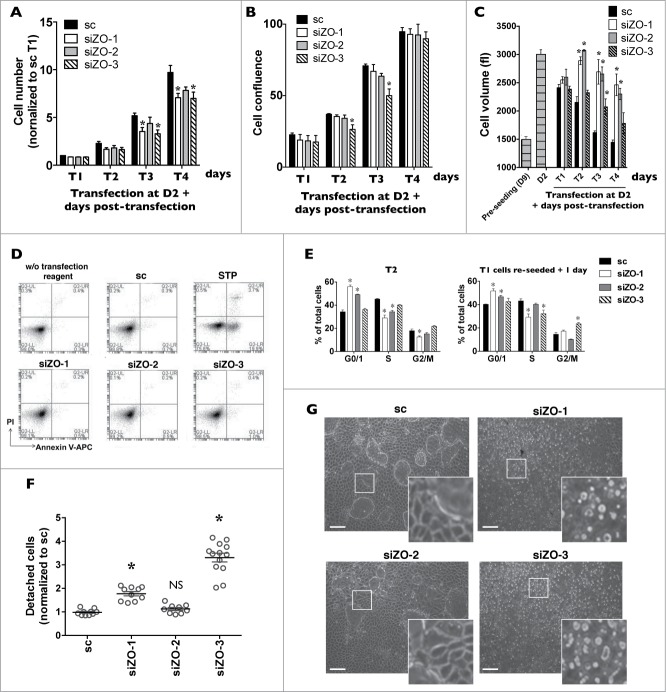
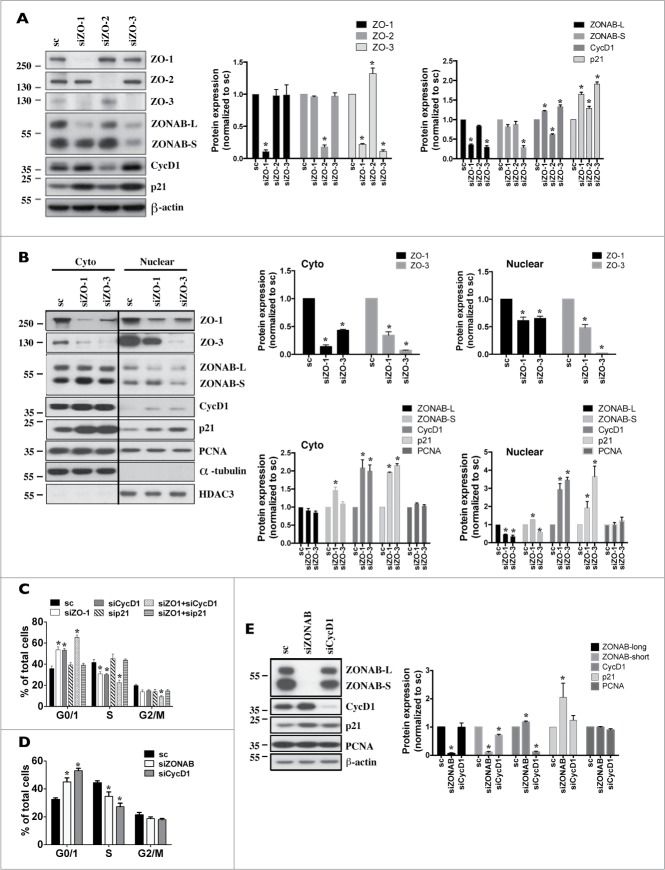
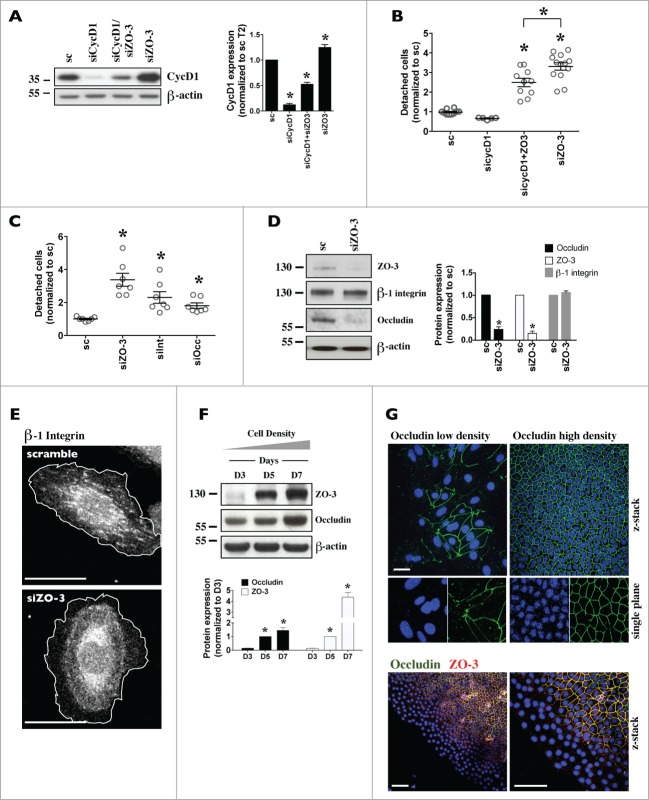
Coordinated cell proliferation and ability to form intercellular seals are essential features of epithelial tissue function. Tight junctions (TJs) classically act as paracellular diffusion barriers. More recently, their role in regulating epithelial cell proliferation in conjunction with scaffolding zonula occludens (ZO) proteins has come to light. The kidney collecting duct (CD) is a model of tight epithelium that displays intense proliferation during embryogenesis followed by very low cell turnover in the adult kidney. Here, we examined the influence of each ZO protein (ZO-1, -2 and -3) on CD cell proliferation. We show that all 3 ZO proteins are strongly expressed in native CD and are present at both intercellular junctions and nuclei of cultured CD principal cells (mCCDcl1). Suppression of either ZO-1 or ZO-2 resulted in increased G0/G1 retention in mCCDcl1 cells. ZO-2 suppression decreased cyclin D1 abundance while ZO-1 suppression was accompanied by increased nuclear p21 localization, the depletion of which restored cell cycle progression. Contrary to ZO-1 and ZO-2, ZO-3 expression at intercellular junctions dramatically increased with cell density and relied on the presence of ZO-1. ZO-3 depletion did not affect cell cycle progression but increased cell detachment. This latter event partly relied on increased nuclear cyclin D1 abundance and was associated with altered β1-integrin subcellular distribution and decreased occludin expression at intercellular junctions. These data reveal diverging, but interconnected, roles for each ZO protein in mCCDcl1 proliferation. While ZO-1 and ZO-2 participate in cell cycle progression, ZO-3 is an important component of cell adhesion.
Keywords: CCD, cortical collecting duct; CD, collecting duct; CycD1, cyclin D1; OMCD, outer medullary collecting duct; PCNA, proliferating cell nuclear antigen; PCT, proximal tubule; TAL, thick ascending limb of Henle's loop; TJ, tight junction; ZO, zonula occludens; ZONAB; ZONAB, ZO-1-associated nucleic acid-binding protein; adhesion; cell cycle; cyclin D1; kidney collecting duct; p21; proliferation; zonula occludens.
Figures
Comment in
-
ZO-oming on growth control by junctional proteins.Cell Cycle. 2015;14(4):472. doi: 10.1080/15384101.2015.1006557. Cell Cycle. 2015. PMID: 25590649 Free PMC article. No abstract available.
Similar articles
-
ZO-2 Is a Master Regulator of Gene Expression, Cell Proliferation, Cytoarchitecture, and Cell Size.Int J Mol Sci. 2019 Aug 24;20(17):4128. doi: 10.3390/ijms20174128. Int J Mol Sci. 2019. PMID: 31450555 Free PMC article. Review.
-
ZO proteins redundantly regulate the transcription factor DbpA/ZONAB.J Biol Chem. 2014 Aug 8;289(32):22500-11. doi: 10.1074/jbc.M114.556449. Epub 2014 Jul 1. J Biol Chem. 2014. PMID: 24986862 Free PMC article.
-
ZO-oming on growth control by junctional proteins.Cell Cycle. 2015;14(4):472. doi: 10.1080/15384101.2015.1006557. Cell Cycle. 2015. PMID: 25590649 Free PMC article. No abstract available.
-
Sorting nexin 27 (SNX27) associates with zonula occludens-2 (ZO-2) and modulates the epithelial tight junction.Biochem J. 2013 Oct 1;455(1):95-106. doi: 10.1042/BJ20121755. Biochem J. 2013. PMID: 23826934 Free PMC article.
-
ZO-2, a tight junction protein involved in gene expression, proliferation, apoptosis, and cell size regulation.Ann N Y Acad Sci. 2017 Jun;1397(1):35-53. doi: 10.1111/nyas.13334. Epub 2017 Apr 17. Ann N Y Acad Sci. 2017. PMID: 28415133 Review.
Cited by
-
Neonatal Hyperoxia Downregulates Claudin-4, Occludin, and ZO-1 Expression in Rat Kidney Accompanied by Impaired Proximal Tubular Development.Oxid Med Cell Longev. 2020 Dec 2;2020:2641461. doi: 10.1155/2020/2641461. eCollection 2020. Oxid Med Cell Longev. 2020. PMID: 33343804 Free PMC article.
-
Loss of DLG5 promotes breast cancer malignancy by inhibiting the Hippo signaling pathway.Sci Rep. 2017 Feb 7;7:42125. doi: 10.1038/srep42125. Sci Rep. 2017. PMID: 28169360 Free PMC article.
-
Loss of GM130 in breast cancer cells and its effects on cell migration, invasion and polarity.Cell Cycle. 2015;14(8):1139-47. doi: 10.1080/15384101.2015.1007771. Cell Cycle. 2015. PMID: 25892554 Free PMC article.
-
ZO-2 Is a Master Regulator of Gene Expression, Cell Proliferation, Cytoarchitecture, and Cell Size.Int J Mol Sci. 2019 Aug 24;20(17):4128. doi: 10.3390/ijms20174128. Int J Mol Sci. 2019. PMID: 31450555 Free PMC article. Review.
-
ZIP4 Promotes Pancreatic Cancer Progression by Repressing ZO-1 and Claudin-1 through a ZEB1-Dependent Transcriptional Mechanism.Clin Cancer Res. 2018 Jul 1;24(13):3186-3196. doi: 10.1158/1078-0432.CCR-18-0263. Epub 2018 Apr 3. Clin Cancer Res. 2018. PMID: 29615456 Free PMC article.
References
-
- Steed E, Balda MS, Matter K. Dynamics and functions of tight junctions. Trends Cell Biol 2010; 20:142-9; PMID:20061152; http://dx.doi.org/10.1016/j.tcb.2009.12.002 - DOI - PubMed
-
- Amasheh S, Fromm M, Gunzel D. Claudins of intestine and nephron - a correlation of molecular tight junction structure and barrier function. Acta Physiol (Oxf) 2011; 201:133-40; PMID:20518752; http://dx.doi.org/10.1111/j.1748-1716.2010.02148.x - DOI - PubMed
-
- Van Itallie CM, Anderson JM. Claudins and epithelial paracellular transport. Ann Rev Physiol 2006; 68:403-29; PMID:16460278; http://dx.doi.org/10.1146/annurev.physiol.68.040104.131404 - DOI - PubMed
-
- Will C, Fromm M, Muller D. Claudin tight junction proteins: novel aspects in paracellular transport. Peritoneal dialysis international : J Int Soc Peritoneal Dial 2008; 28:577-84. - PubMed
Publication types
MeSH terms
Substances
LinkOut - more resources
Full Text Sources
Other Literature Sources
Molecular Biology Databases
Research Materials
Miscellaneous