

Virus-host arms race at the joint origin of multicellularity and programmed cell death
- PMID: 25486567
- PMCID: PMC4615056
- DOI: 10.4161/15384101.2014.949496
Virus-host arms race at the joint origin of multicellularity and programmed cell death
Abstract
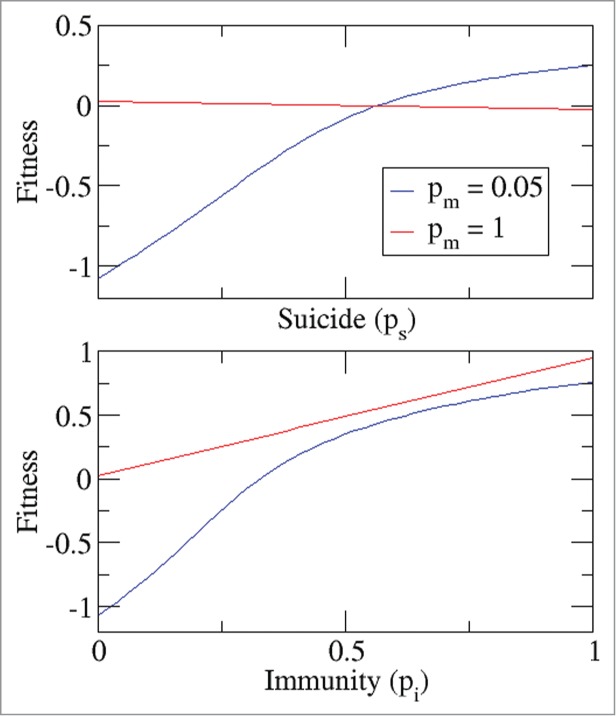
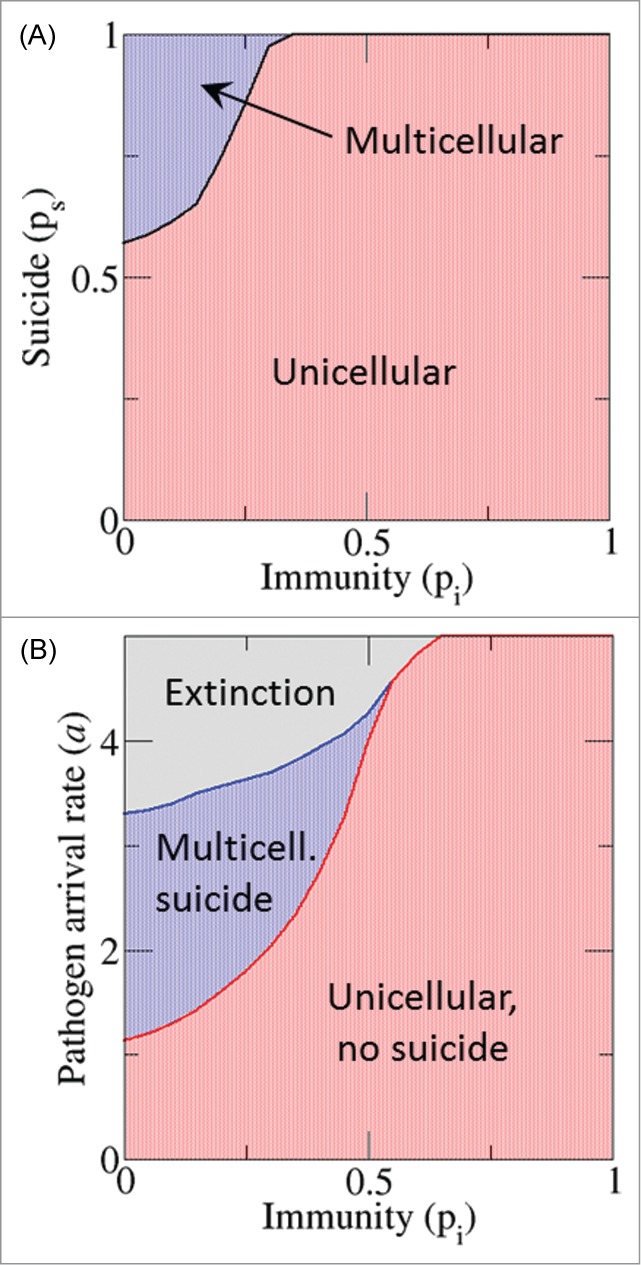
Unicellular eukaryotes and most prokaryotes possess distinct mechanisms of programmed cell death (PCD). How an "altruistic" trait, such as PCD, could evolve in unicellular organisms? To address this question, we developed a mathematical model of the virus-host co-evolution that involves interaction between immunity, PCD and cellular aggregation. Analysis of the parameter space of this model shows that under high virus load and imperfect immunity, joint evolution of cell aggregation and PCD is the optimal evolutionary strategy. Given the abundance of viruses in diverse habitats and the wide spread of PCD in most organisms, these findings imply that multiple instances of the emergence of multicellularity and its essential attribute, PCD, could have been driven, at least in part, by the virus-host arms race.
Keywords: AI, abortive infection; PCD, programmed cell death; TA, toxin-antitoxin; evolution of multicellularity; host-parasite arms race; programmed cell death; viruses.
Figures
Similar articles
-
Cell Death in Evolutionary Transitions in Individuality.Yale J Biol Med. 2019 Dec 20;92(4):651-662. eCollection 2019 Dec. Yale J Biol Med. 2019. PMID: 31866780 Free PMC article. Review.
-
Programmed cell death in the cellular differentiation of microbial eukaryotes.Curr Opin Microbiol. 2012 Dec;15(6):646-52. doi: 10.1016/j.mib.2012.09.005. Epub 2012 Oct 17. Curr Opin Microbiol. 2012. PMID: 23083808 Review.
-
Programmed cell death in unicellular parasites: a prerequisite for sustained infection?Trends Parasitol. 2010 Oct;26(10):477-83. doi: 10.1016/j.pt.2010.06.008. Epub 2010 Jun 28. Trends Parasitol. 2010. PMID: 20591738
-
Symbiotic Origin of Apoptosis.Results Probl Cell Differ. 2020;69:253-280. doi: 10.1007/978-3-030-51849-3_10. Results Probl Cell Differ. 2020. PMID: 33263876
-
Apoptosis and parasitism: from the parasite to the host immune response.Adv Parasitol. 2001;49:133-61. doi: 10.1016/s0065-308x(01)49039-7. Adv Parasitol. 2001. PMID: 11461030 Review.
Cited by
-
Yeast cell death pathway requiring AP-3 vesicle trafficking leads to vacuole/lysosome membrane permeabilization.Cell Rep. 2022 Apr 12;39(2):110647. doi: 10.1016/j.celrep.2022.110647. Cell Rep. 2022. PMID: 35417721 Free PMC article.
-
Cell Death in Evolutionary Transitions in Individuality.Yale J Biol Med. 2019 Dec 20;92(4):651-662. eCollection 2019 Dec. Yale J Biol Med. 2019. PMID: 31866780 Free PMC article. Review.
-
Origin of programmed cell death from antiviral defense?Proc Natl Acad Sci U S A. 2019 Aug 13;116(33):16167-16169. doi: 10.1073/pnas.1910303116. Epub 2019 Jul 9. Proc Natl Acad Sci U S A. 2019. PMID: 31289224 Free PMC article. No abstract available.
-
Stable coevolutionary regimes for genetic parasites and their hosts: you must differ to coevolve.Biol Direct. 2018 Dec 14;13(1):27. doi: 10.1186/s13062-018-0230-9. Biol Direct. 2018. PMID: 30621743 Free PMC article.
-
Phage "delay" towards enhancing bacterial escape from biofilms: a more comprehensive way of viewing resistance to bacteriophages.AIMS Microbiol. 2017 Mar 31;3(2):186-226. doi: 10.3934/microbiol.2017.2.186. eCollection 2017. AIMS Microbiol. 2017. PMID: 31294157 Free PMC article.
References
-
- Edwards RA, Rohwer F. Viral metagenomics. Nat Rev Microbiol 2005; 3:504-10; PMID: 15886693; http://dx.doi.org/10.1038/nrmicro1163 - DOI - PubMed
-
- Suttle CA. Viruses in the sea. Nature 2005; 437:356-61; PMID:16163346; http://dx.doi.org/10.1038/nature04160 - DOI - PubMed
-
- Suttle CA. Marine viruses - major players in the global ecosystem. Nat Rev Microbiol. 2007; 5:801-2; PMID: 17853907; http://dx.doi.org/10.1038/nrmicro1750 - DOI - PubMed
-
- Koonin EV, Dolja VV. A virocentric perspective on the evolution of life. Curr Opin Virol 2013; 3:546-57; PMID: 23850169; http://dx.doi.org/929929910.1016/j.coviro.2013.06.008 - DOI - PMC - PubMed
-
- Szathmary E, Maynard Smith J. From replicators to reproducers: the first major transitions leading to life. J Theor Biol 1997; 187:555-71; PMID:9299299; http://dx.doi.org/10.1006/jtbi.1996.0389 - DOI - PubMed
Publication types
MeSH terms
Grants and funding
LinkOut - more resources
Full Text Sources
Other Literature Sources