

The microRNA miR-29a is associated with human immunodeficiency virus latency
- PMID: 25486977
- PMCID: PMC4269869
- DOI: 10.1186/s12977-014-0108-6
The microRNA miR-29a is associated with human immunodeficiency virus latency
Abstract
Background: Latent reservoirs of HIV-1 provide a major challenge to its cure. There are increasing reports of interplay between HIV-1 replication and host miRNAs. Several host miRNAs, which potentially target the nef-3'LTR region of HIV-1 RNA, including miR-29a, are proposed to promote latency.
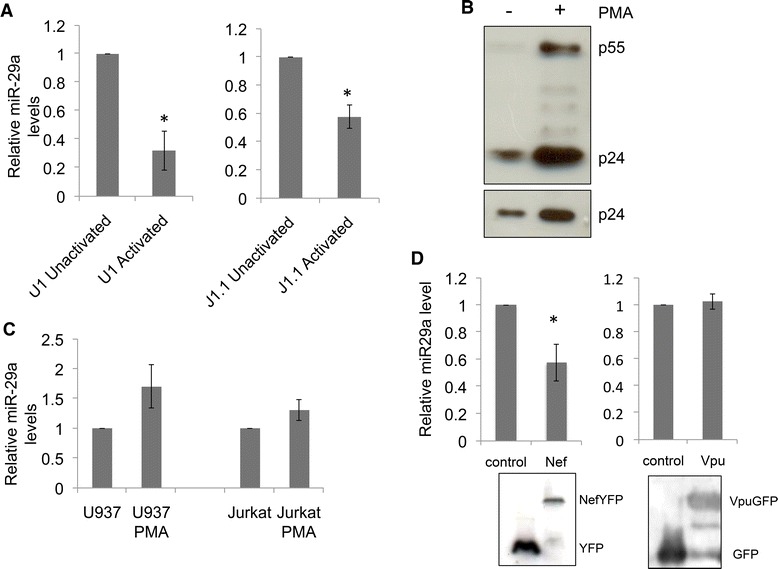
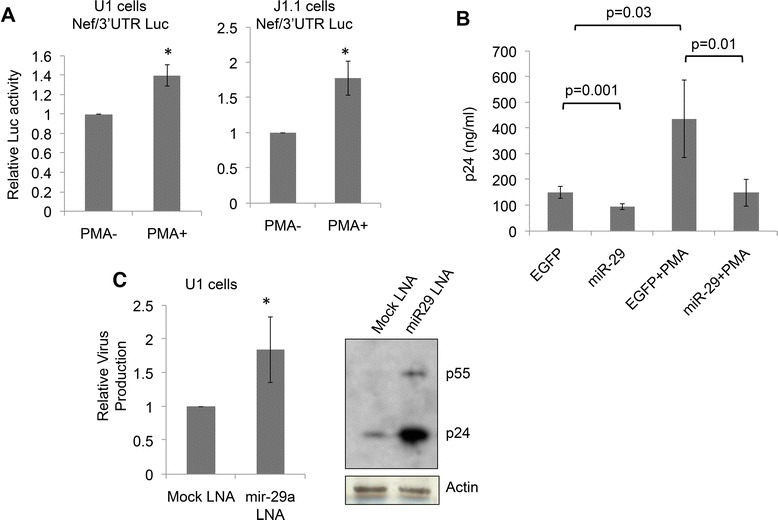
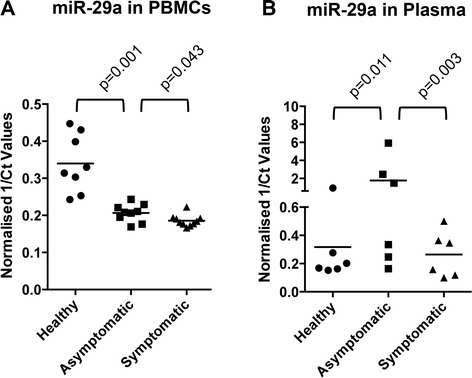
Findings: We used two established cellular models of HIV-1 latency - the U1 monocytic and J1.1 CD4+ T cell lines to show an inverse relationship between HIV-1 replication and miR-29a levels, which was mediated by the HIV-1 Nef protein. Using a miR-29a responsive luciferase reporter plasmid, an expression plasmid and an anti-miR29a LNA, we further demonstrate increased miR-29a levels during latency and reduced levels following active HIV replication. Finally, we show that miR-29a levels in the PBMCs and plasma of HIV infected persons also correlate inversely with latency and active viral replication.
Conclusions: The levels of miR-29a correlate inversely with active HIV-1 replication in cell culture models and in HIV infected persons. This links miR-29a to viral latency and suggests another approach to activate and destroy latent HIV-1 reservoirs.
Figures
Similar articles
-
Human cellular microRNA hsa-miR-29a interferes with viral nef protein expression and HIV-1 replication.Retrovirology. 2008 Dec 23;5:117. doi: 10.1186/1742-4690-5-117. Retrovirology. 2008. PMID: 19102781 Free PMC article.
-
Cellular microRNAs contribute to HIV-1 latency in resting primary CD4+ T lymphocytes.Nat Med. 2007 Oct;13(10):1241-7. doi: 10.1038/nm1639. Epub 2007 Sep 30. Nat Med. 2007. PMID: 17906637
-
Two cellular microRNAs, miR-196b and miR-1290, contribute to HIV-1 latency.Virology. 2015 Dec;486:228-38. doi: 10.1016/j.virol.2015.09.016. Epub 2015 Oct 27. Virology. 2015. PMID: 26469550
-
MicroRNA-mediated restriction of HIV-1 in resting CD4+ T cells and monocytes.Viruses. 2012 Sep;4(9):1390-409. doi: 10.3390/v4091390. Epub 2012 Aug 29. Viruses. 2012. PMID: 23170164 Free PMC article. Review.
-
Modulation of apoptosis and viral latency - an axis to be well understood for successful cure of human immunodeficiency virus.J Gen Virol. 2016 Apr;97(4):813-824. doi: 10.1099/jgv.0.000402. Epub 2016 Jan 13. J Gen Virol. 2016. PMID: 26764023 Review.
Cited by
-
MicroRNAs and long non-coding RNAs during transcriptional regulation and latency of HIV and HTLV.Retrovirology. 2024 Feb 29;21(1):5. doi: 10.1186/s12977-024-00637-y. Retrovirology. 2024. PMID: 38424561 Free PMC article. Review.
-
RNA landscapes of brain tissue and brain tissue-derived extracellular vesicles in simian immunodeficiency virus (SIV) infection and SIV-related central nervous system pathology.bioRxiv [Preprint]. 2023 Apr 29:2023.04.01.535193. doi: 10.1101/2023.04.01.535193. bioRxiv. 2023. Update in: J Infect Dis. 2024 May 15;229(5):1295-1305. doi: 10.1093/infdis/jiad563. PMID: 37034720 Free PMC article. Updated. Preprint.
-
The role of miR-29a in HIV-1 replication and latency.J Virus Erad. 2017 Oct 1;3(4):185-191. doi: 10.1016/S2055-6640(20)30322-8. J Virus Erad. 2017. PMID: 29057080 Free PMC article.
-
Plasma vesicular miR-155 as a biomarker of immune activation in antiretroviral treated people living with HIV.Front Immunol. 2022 Aug 29;13:916599. doi: 10.3389/fimmu.2022.916599. eCollection 2022. Front Immunol. 2022. PMID: 36105810 Free PMC article.
-
Unique microRNA expression in the colonic mucosa during chronic HIV-1 infection.AIDS. 2017 Sep 10;31(14):1925-1934. doi: 10.1097/QAD.0000000000001582. AIDS. 2017. PMID: 28692540 Free PMC article.
References
-
- Gottwein E. Roles of microRNAs in the life cycles of mammalian viruses. Current Topics Microbiol Immunol. 2013;371:201–227. - PubMed
Publication types
MeSH terms
Substances
LinkOut - more resources
Full Text Sources
Other Literature Sources
Research Materials
