. 2014 Dec 9;15(1):1080.
doi: 10.1186/1471-2164-15-1080.

Next-generation sequencing of flow-sorted wheat chromosome 5D reveals lineage-specific translocations and widespread gene duplications

Affiliations

Next-generation sequencing of flow-sorted wheat chromosome 5D reveals lineage-specific translocations and widespread gene duplications

Stuart J Lucas et al. BMC Genomics. .

Abstract

Background: The ~17 Gb hexaploid bread wheat genome is a high priority and a major technical challenge for genomic studies. In particular, the D sub-genome is relatively lacking in genetic diversity, making it both difficult to map genetically, and a target for introgression of agriculturally useful traits. Elucidating its sequence and structure will therefore facilitate wheat breeding and crop improvement.

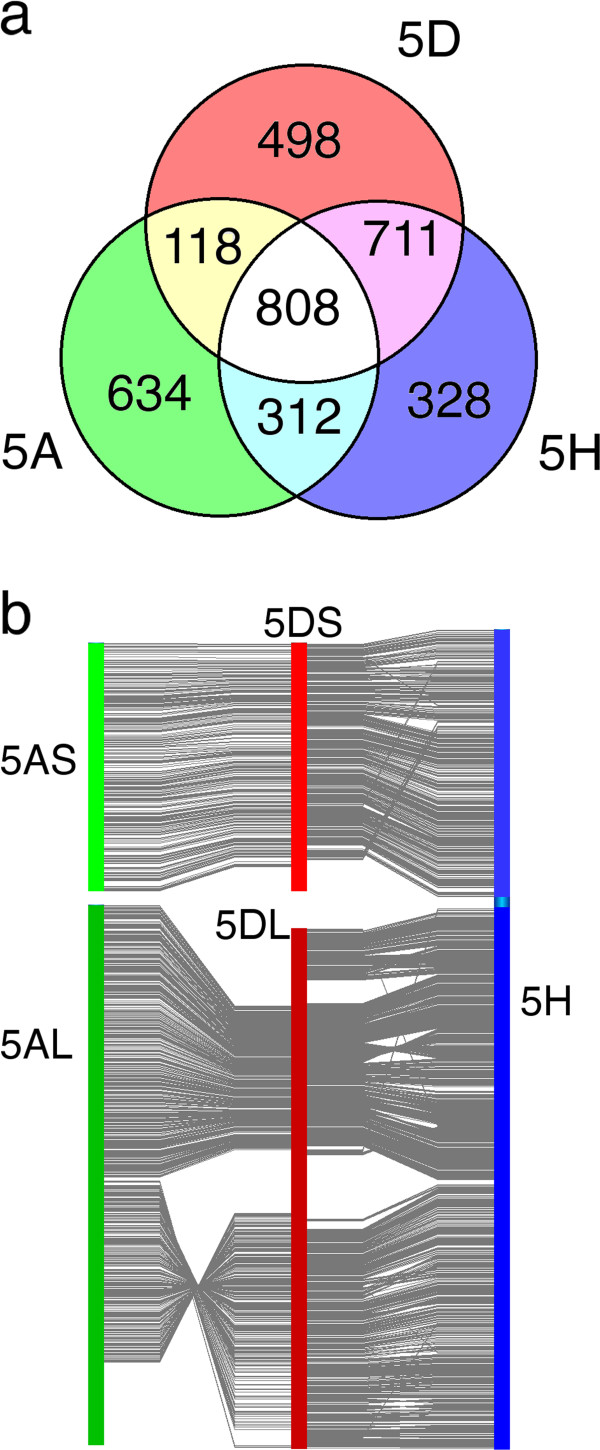
Results: We generated shotgun sequences from each arm of flow-sorted Triticum aestivum chromosome 5D using 454 FLX Titanium technology, giving 1.34× and 1.61× coverage of the short (5DS) and long (5DL) arms of the chromosome respectively. By a combination of sequence similarity and assembly-based methods, ~74% of the sequence reads were classified as repetitive elements, and coding sequence models of 1314 (5DS) and 2975 (5DL) genes were generated. The order of conserved genes in syntenic regions of previously sequenced grass genomes were integrated with physical and genetic map positions of 518 wheat markers to establish a virtual gene order for chromosome 5D.

Conclusions: The virtual gene order revealed a large-scale chromosomal rearrangement in the peri-centromeric region of 5DL, and a concentration of non-syntenic genes in the telomeric region of 5DS. Although our data support the large-scale conservation of Triticeae chromosome structure, they also suggest that some regions are evolving rapidly through frequent gene duplications and translocations.

Sequence accessions: EBI European Nucleotide Archive, Study no. ERP002330.


Figures

Figure 1
Figure 1
Gene conservation between sequenced grass genomes and 5D. Venn diagram showing the number of different genes from the genomes of B. distachyon (Bdi), O. sativa (Osa) and S. bicolor (Sbi) with homologous sequences on 5DS (a.) and 5DL (b.). Stars highlight homologs matching each species that form a significantly higher proportion of conserved orthologous genes on one chromosome arm than the other (***p < 0.001, Fisher’s exact test). Light grey shading highlights groups of conserved orthologs for which more than 70% also found an homolog in UniGene/UniProt; dark grey shading, more than 90%.
Figure 2
Figure 2
Putative tRNA genes predicted from sequence reads. Putative tRNA gene predictions for a. repetitive and non-repetitive 5D sequence reads, b. 5D sequence reads compared to predictions from IWGSC Illumina contigs of homeologous group 5 chromosomes [16], c. Non-repetitive 5D sequence reads compared to non-repetitive 5A sequences obtained by the same sequencing technology [10].
Figure 3
Figure 3
Distribution of 5D genes conserved with other grass genomes. All heat maps were drawn using a sliding window approach, with a window size of 500 kb and a step size of 50 kb. a. Heat map showing distribution of 5D sequence reads with homology to genes on B. distachyon (Bd) chromosomes. b. Heat maps comparing the distribution of conserved sequences from chromosomes 5D and 5A on the syntenic B. distachyon chromosomes Bd1 and Bd4. Black bars under each heat map highlight the major syntenic blocks, while * shows the 2 regions of Bd4 which contained a mixture of sequences conserved with 5DS and 5DL.
Figure 4
Figure 4
Syntenic relationships between 5D and sequenced grass species. Circle plot in which reads from 5DS and 5DL are grouped into ribbons linking the chromosomes with which they show homology. Chromosomes of B. distachyon (Bd), S. bicolor (Sb) &O. sativa (Os) are shown as coloured bars around the outside of the circle. The relative abundance of syntenic reads by the position along each chromosome segment is shown by the histograms; yellow indicates genes matching 5DS, red indicates genes matching 5DL. Blocks containing 50 or more genes in 1 Mb that are conserved in 2 or more sequenced species are joined by ribbons, yellow for 5DS and red for 5DL.
Figure 5
Figure 5
Chromosome structure comparison between T. aestivum 5D and B. distachyon. a. Cartoon showing co-linearity between 5D deletion bins and B. distachyon chromosomes 1 (Bd1) and 4 (Bd4), and major rearrangements. Pale coloured bands show large regions of co-linear genes. Coloured lines show smaller translocations where one or a few genes were mapped to a different deletion bin. inv: probable inversion in 5DS relative to Bd4. 1,2,3: segments of 5DL that are rearranged relative to Bd4. b. Graph showing relative contribution of syntenic and non-syntenic genes to each deletion bin, for all genes that were also mapped to a deletion bin. Asterisks indicate statistically significant differences in the composition of bin 5DS2, calculated using Fisher’s exact test (**p < 0.01). Bin 5DS5 was omitted because too few genes mapped to this bin to draw meaningful conclusions.
Figure 6
Figure 6
Comparison of T. aestivum 5D genome zippers with those of T. aestivum 5A and H. vulgare 5H. The sequence of genes syntenic with B. distachyon on each of the three chromosomes was compared. a. Venn diagram showing the number of syntenic genes unique to and common to each pair of chromosomes. b. Comparison of the virtual gene order of 5D (centre) with 5A (left) and 5H (right). Each link shows the relative positions of a syntenic gene common to both chromosomes.
Figure 7
Figure 7
Screening of gene models against other NGS datasets. High- and low-confidence gene models from 5DS and 5DL were searched independently against gene models derived from a. whole genome shotgun 454 sequences [15] and b. chromosome-specific Illumina contigs [16]. Each bar of the histogram shows the % of all gene model hits for each comparison in a 1% sequence identity bin, starting from the value shown on the x-axis (e.g. ‘95%’ = 95.00-95.99%).
Figure 8
Figure 8
Functional annotation of 5D gene models. The total number of annotations for all Gene Ontology terms that matched 20 or more gene models is summarized in the a. Biological Process, b. Cellular Component, and c. Molecular Function categories. Significant differences between conserved and non-conserved gene model annotations for a given term are indicated by asterisks, deduced from Fisher’s exact test for two-tailed probabilities (*p-value <0.05, **p < 0.01, ***p < 0.001).

References

    1. Gill BS, Appels R, Botha-Oberholster A-M, Buell CR, Bennetzen JL, Chalhoub B, Chumley F, Dvorák J, Iwanaga M, Keller B, Li W, McCombie WR, Ogihara Y, Quetier F, Sasaki T. A workshop report on wheat genome sequencing: ınternational genome research on wheat consortium. Genetics. 2004;168:1087–1096. doi: 10.1534/genetics.104.034769. - DOI - PMC - PubMed
    1. Peng JH, Sun D, Nevo E. Domestication evolution, genetics and genomics in wheat. Mol Breed. 2011;28:281–301. doi: 10.1007/s11032-011-9608-4. - DOI
    1. Feuillet C, Leach JE, Rogers J, Schnable PS, Eversole K. Crop genome sequencing: lessons and rationales. Trends Plant Sci. 2011;16:77–88. doi: 10.1016/j.tplants.2010.10.005. - DOI - PubMed
    1. Kubaláková M, Vrána J, Číhalíková J, Šimková H, Doležel J. Flow karyotyping and chromosome sorting in bread wheat (Triticum aestivum L.) Theor Appl Genet. 2002;104:1362–1372. doi: 10.1007/s00122-002-0888-2. - DOI - PubMed
    1. Šafář J, Šimková H, Kubaláková M, Číhalíková J, Suchánková P, Bartoš J, Doležel J. Development of chromosome-specific BAC resources for genomics of bread wheat. Cytogenet Genome Res. 2010;129:211–223. doi: 10.1159/000313072. - DOI - PubMed

Publication types

LinkOut - more resources