. 2015 Jan 8;517(7533):227-30.
doi: 10.1038/nature14043. Epub 2014 Dec 10.

The heat released during catalytic turnover enhances the diffusion of an enzyme

Affiliations

The heat released during catalytic turnover enhances the diffusion of an enzyme

Clement Riedel et al. Nature. .

Abstract

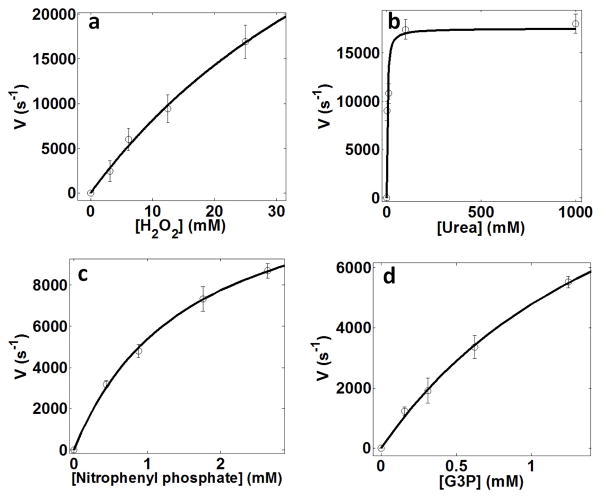
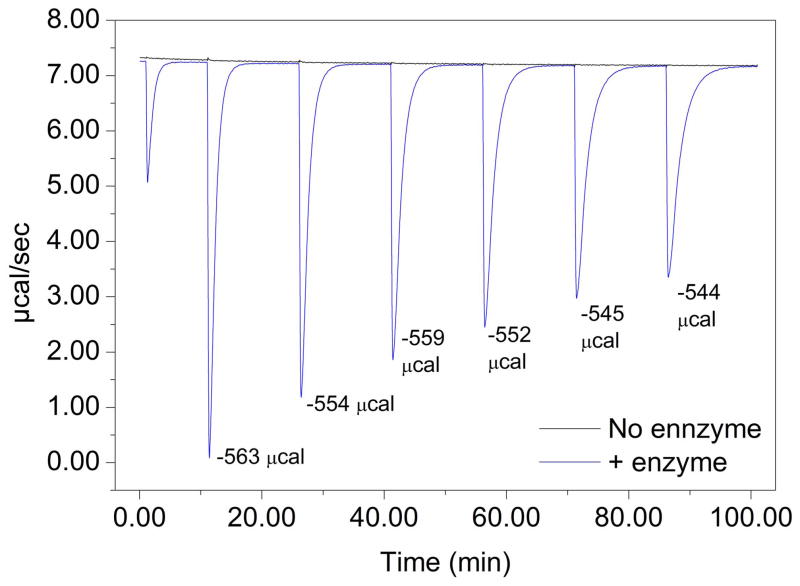
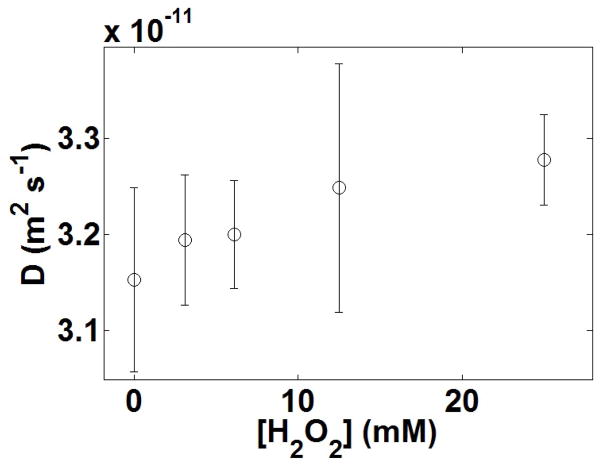
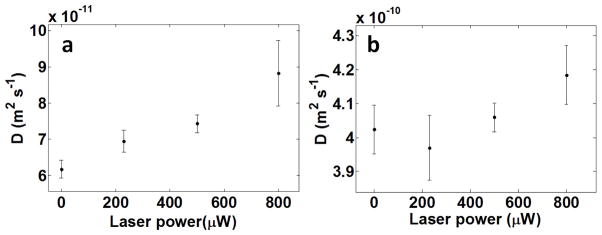
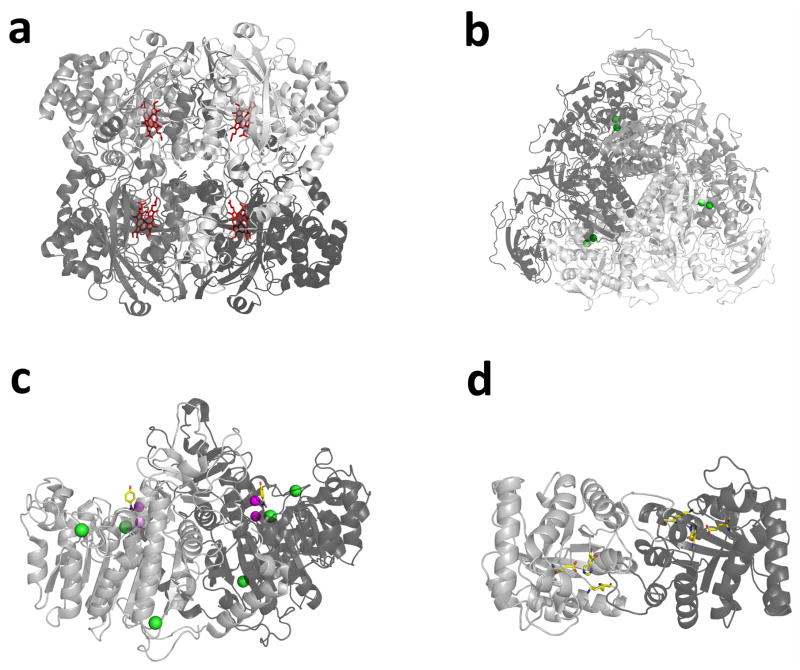
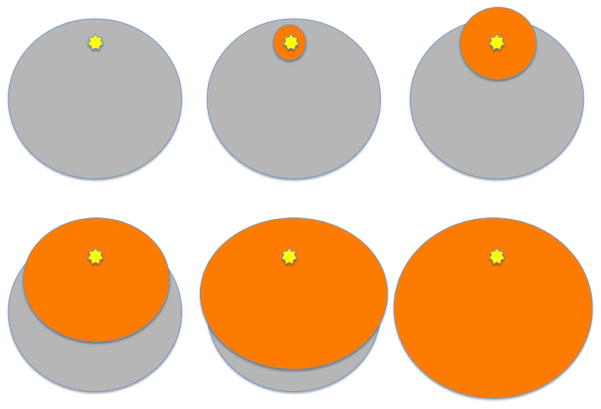
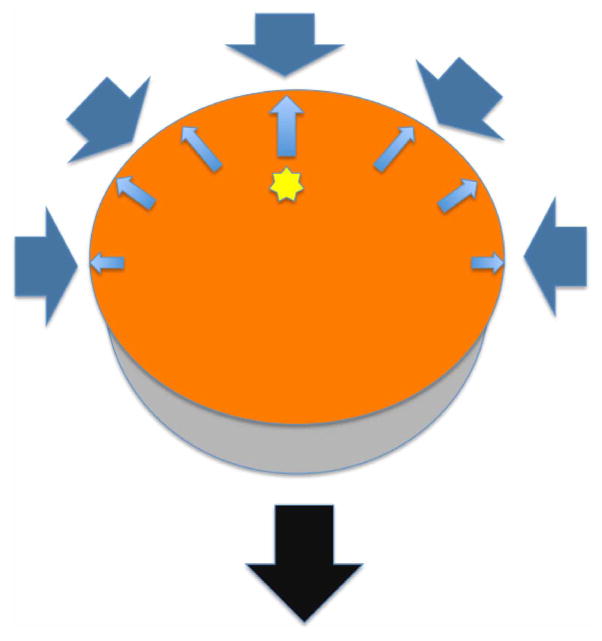
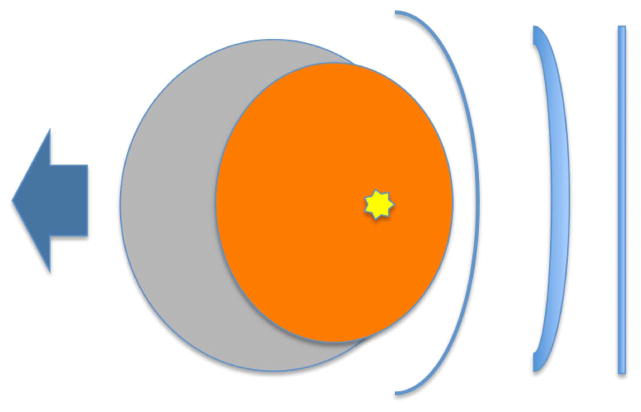
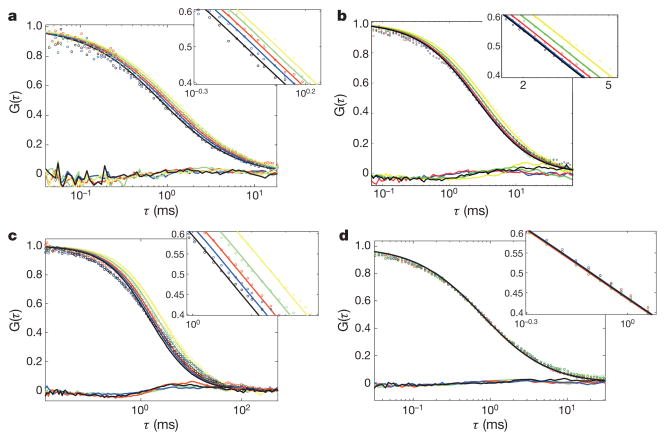
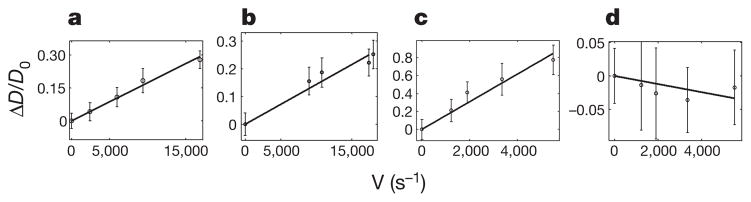
Recent studies have shown that the diffusivity of enzymes increases in a substrate-dependent manner during catalysis. Although this observation has been reported and characterized for several different systems, the precise origin of this phenomenon is unknown. Calorimetric methods are often used to determine enthalpies from enzyme-catalysed reactions and can therefore provide important insight into their reaction mechanisms. The ensemble averages involved in traditional bulk calorimetry cannot probe the transient effects that the energy exchanged in a reaction may have on the catalyst. Here we obtain single-molecule fluorescence correlation spectroscopy data and analyse them within the framework of a stochastic theory to demonstrate a mechanistic link between the enhanced diffusion of a single enzyme molecule and the heat released in the reaction. We propose that the heat released during catalysis generates an asymmetric pressure wave that results in a differential stress at the protein-solvent interface that transiently displaces the centre-of-mass of the enzyme (chemoacoustic effect). This novel perspective on how enzymes respond to the energy released during catalysis suggests a possible effect of the heat of reaction on the structural integrity and internal degrees of freedom of the enzyme.


Conflict of interest statement

The authors declare no competing financial interests.

Figures

Extended Data Figure 1
Extended Data Figure 1. Reaction rate per enzyme molecule as a function of the concentration of substrate
a, Catalase; b, urease; c, alkaline phosphatase and d, triose phosphate isomerase. Lines are fit to a Michaelis–Menten curve. Error bars represent the standard deviation of 3 measurements.
Extended Data Figure 2
Extended Data Figure 2. Isothermal titration calorimetry measurement of the heat of hydrolysis of p-nitrophenylphosphate by alkaline phosphatase
Each peak corresponds to the hydrolysis of 0.053 μmol of substrate. The reaction rate slows as more substrate is added owing to the accumulation of phosphate product inhibiting the enzyme.
Extended Data Figure 3
Extended Data Figure 3. Diffusion coefficient of non-reactive urease in the presence of active, non-labelled, catalase (1 nM) for different concentrations of hydrogen peroxide
Even at the highest catalase activity no indirect effects (due to bubbling or global heating of the solution) appreciably increase the diffusion coefficient of freely diffusing urease. Error bars are computed from the standard deviation over 10 measurements.
Extended Data Figure 4
Extended Data Figure 4. Haem excitation experiment
a, Diffusion coefficient of catalase as a function of the laser power at 402 nm. The heat released by the haem enhances the diffusion of the enzyme. b, Diffusion coefficient of free dyes in the presence of non-labelled heat-emitting catalase. Neither the heat generated by the laser power nor the heat released by catalase significantly enhances the diffusion of the dyes. Error bars are computed from the standard deviation over 10 measurements.
Extended Data Figure 5
Extended Data Figure 5. Structures of the enzymes studied with active site components highlighted
Different shades of grey indicate different monomers. a, Catalase (PDB 3NWL). Haem groups are shown as red sticks. b, Urease (PDB 4GY7). Active site nickel ions are shown as green spheres. c, Alkaline phosphatase (PDB 4KJG). Magnesium ions are shown in green; zinc ions are shown in magenta; 4-nitrophenol (hydrolysis product bound at the active site) is shown as yellow sticks. d, Triose phosphate isomerase (8TIM). Active site residues Lys 12, His 95 and Glu 165 are shown as yellow sticks.
Extended Data Figure 6
Extended Data Figure 6. Protein deformation progression
Spread of a radial deformation wave (red) emanating from the catalytic site (yellow star). The protein (grey) has an approximate radius of 4 nm and the deformation wave speed is an estimated 3 nm ps−1.
Extended Data Figure 7
Extended Data Figure 7. Centre of mass translation
The protein exerts forces on the solvent (small blue arrows). The solvent restoring forces (thick blue arrows) give rise to a protein centre of mass translation (black arrow).
Extended Data Figure 8
Extended Data Figure 8. Acoustic wave due to deformation
Here we assume the protein deforms and this generates acoustic waves in the solvent. If these acoustic waves were reflected back on the protein, they would give rise to a centre of mass translation denoted by the blue arrow.
Figure 1
Figure 1. FCS data and residuals of the fits
G(τ) is the normalized correlation function. Insets: zoom around the inflexion point. Lines are fits by a normal diffusion model with a single diffusive species. a, Catalase. Hydrogen peroxide concentration: yellow, 0 mM; green, 3 mM; red, 6 mM; blue, 12 mM; black, 25 mM. b, Urease. Urea concentration: yellow, 0 mM; green, 1 mM; red, 10 mM; blue, 100 mM; black, 1 M. c, Alkaline phosphatase. p-Nitrophenylphosphate concentration: yellow, 0 mM; green, 0.44 mM; red, 0.88 mM; blue, 1.74 mM; black, 2.64 mM. d, TIM. D-Glyceraldehyde 3-phosphate concentration: yellow, 0 mM; green, 0.15 mM; red, 0.31 mM; blue, 0.62 mM; black, 1.3 mM.
Figure 2
Figure 2. Enhanced diffusion as a function of the reaction rate
ad, Dimensionless change in diffusion coefficient (ΔD =(DD0)/D0) as a function of the reaction rate for catalase (a), urease (b), alkaline phosphatase (c) and triose phosphate isomerase (d). Error bars represent the standard deviation of 10 measurements.

Comment in

References

    1. Muddana HS, Sengupta S, Mallouk TE, Sen A, Butler PJ. Substrate catalysis enhances single-enzyme diffusion. J Am Chem Soc. 2010;132:2110–2111. - PMC - PubMed
    1. Sengupta S, et al. Enzyme molecules as nanomotors. J Am Chem Soc. 2013;135:1406–1414. - PubMed
    1. Sánchez S, Pumera M. Nanorobots: The ultimate wireless self-propelled sensing and actuating devices. Chem Asian J. 2009;4:1402–1410. - PubMed
    1. Wang J. Can man-made nanomachines compete with nature biomotors? ACS Nano. 2009;3:4–9. - PubMed
    1. Howse JR, et al. Self-motile colloidal particles: from directed propulsion to random walk. Phys Rev Lett. 2007;99:048102. - PubMed

Publication types