. 2015 Mar 12;519(7542):219-22.
doi: 10.1038/nature13996. Epub 2014 Dec 10.

Spatiotemporal transcriptomics reveals the evolutionary history of the endoderm germ layer

Affiliations

Spatiotemporal transcriptomics reveals the evolutionary history of the endoderm germ layer

Tamar Hashimshony et al. Nature. .

Abstract

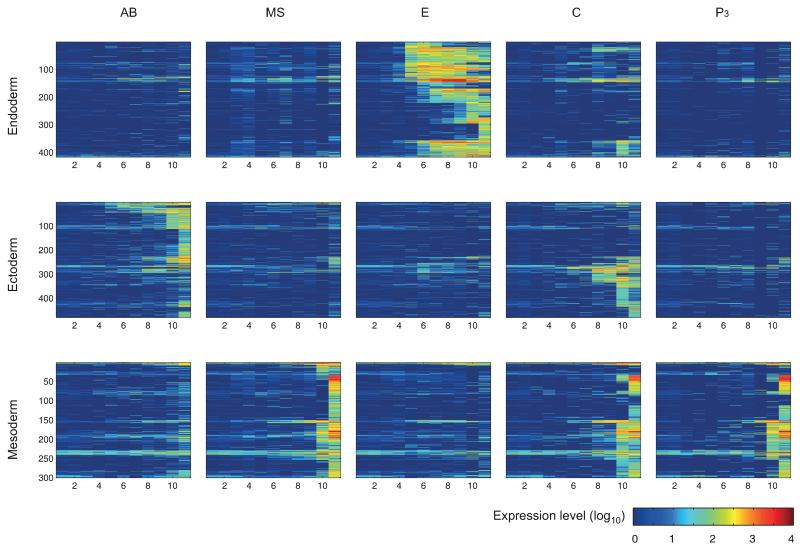
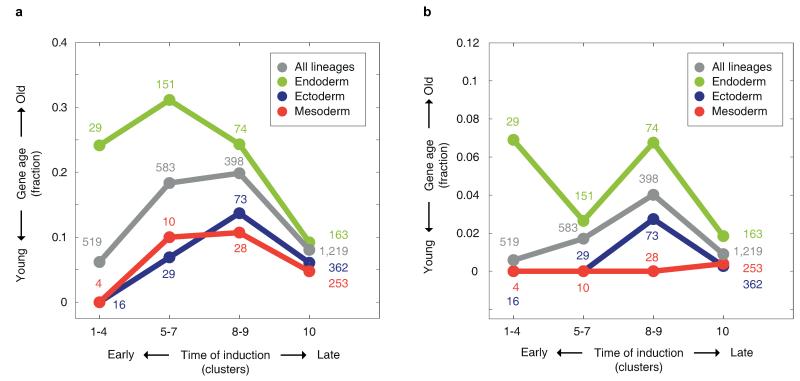
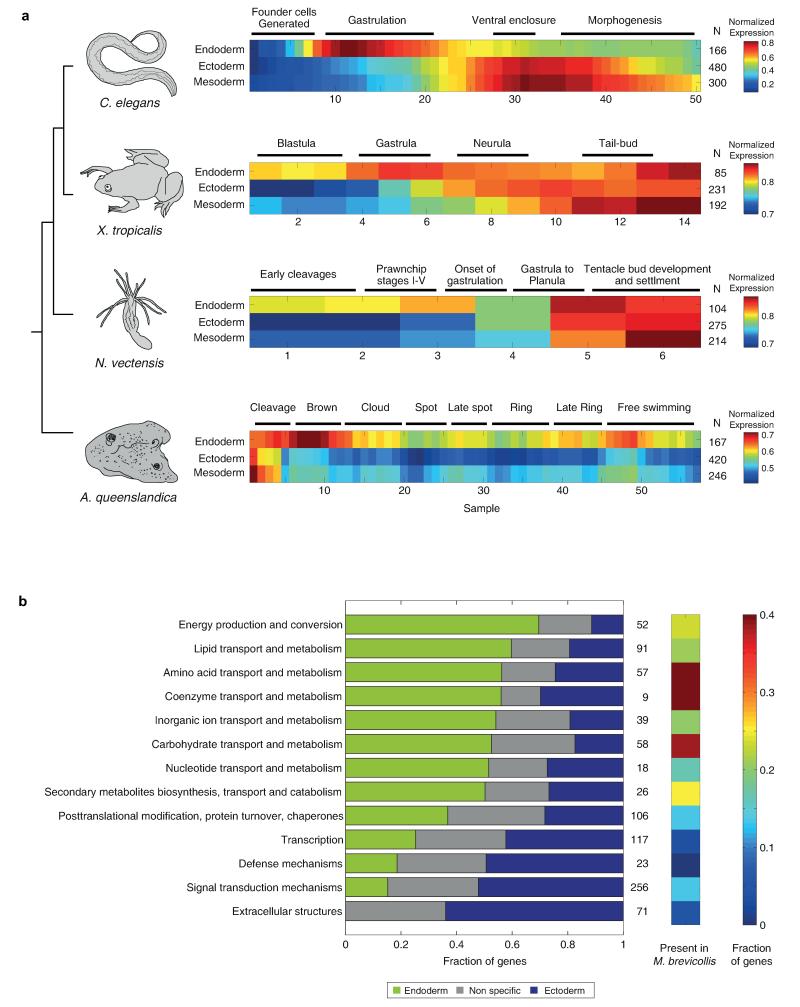
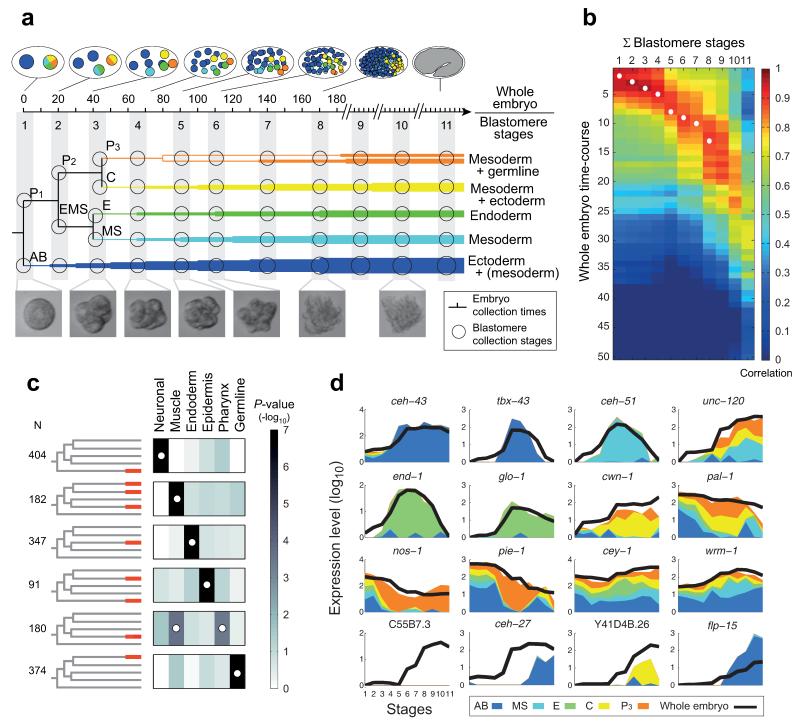
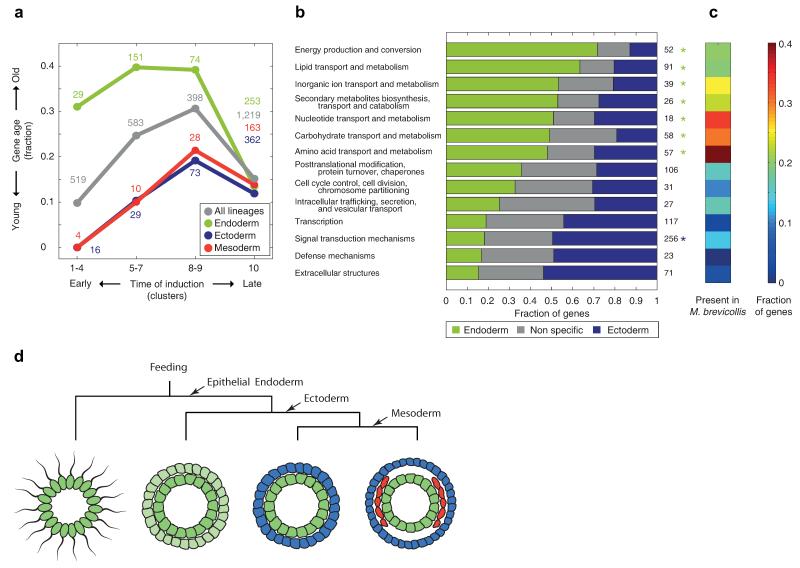
The concept of germ layers has been one of the foremost organizing principles in developmental biology, classification, systematics and evolution for 150 years (refs 1 - 3). Of the three germ layers, the mesoderm is found in bilaterian animals but is absent in species in the phyla Cnidaria and Ctenophora, which has been taken as evidence that the mesoderm was the final germ layer to evolve. The origin of the ectoderm and endoderm germ layers, however, remains unclear, with models supporting the antecedence of each as well as a simultaneous origin. Here we determine the temporal and spatial components of gene expression spanning embryonic development for all Caenorhabditis elegans genes and use it to determine the evolutionary ages of the germ layers. The gene expression program of the mesoderm is induced after those of the ectoderm and endoderm, thus making it the last germ layer both to evolve and to develop. Strikingly, the C. elegans endoderm and ectoderm expression programs do not co-induce; rather the endoderm activates earlier, and this is also observed in the expression of endoderm orthologues during the embryology of the frog Xenopus tropicalis, the sea anemone Nematostella vectensis and the sponge Amphimedon queenslandica. Querying the phylogenetic ages of specifically expressed genes reveals that the endoderm comprises older genes. Taken together, we propose that the endoderm program dates back to the origin of multicellularity, whereas the ectoderm originated as a secondary germ layer freed from ancestral feeding functions.


Figures

Extended Data Figure 1
Extended Data Figure 1. In vitro culturing of the C. elegans embryonic founder blastomeres
The cells are separated as shown in the left schematic and then cultured in embryonic growth medium as shown in the micrographs on the right. The numbers indicate the stages in which the cells were collected for transcriptome analysis. Six of the eleven stages are shown in the micrographs.
Extended Data Figure 2
Extended Data Figure 2. A transcriptomic survey of C. elegans embryonic founder cell lineages
a, Replicates of the embryonic blastomere time-courses. The heatmaps show the correlations among the replicates for each blastomere lineage at each of the eleven examined stages. For three blastomere/stages there were no replicates. The median correlation coefficient is 0.9. Samples were collected in triplicates. Only samples with at least 750,000 reads were used which has been previously shown to be of sufficient sequencing depth for CEL-Seq. Supplementary Table 3 provides the sequencing statistics for each sample. b, Expression profiles of the 3,910 dynamic genes across the blastomere lineage time-courses. See methods for definition of dynamic genes. c, Correlation coefficients between samples of the whole embryo time-course. Each of the 50 samples comprises a single embryo, collected at the indicated minutes past the 4-cell stage. Again, only samples with at least 750,000 reads were used and Supplementary Table 3 provides the sequencing statistics for each sample. d, The expression profiles of the 1,664 genes with differentiated expression analyzed in Figure 1c. Each profile was “standardized” by subtracting its mean and dividing by its standard deviation. e, Comparison of the blastomere time-courses to the EPIC dataset. For 115 genes, we could compare gene expression to previously published embryonic expression profiles generated by microscopic lineaging until the ~300-cell stage,39. Of these, 75% of our profiles had consistent localized expression (Supplementary Table 1). Of those, 54% matched completely, and 21% of the genes, expressed in all of the lineages in our dataset had some missing expression in the EPIC dataset because the lineaging was not carried out until the end of the developmental process. The remaining genes have some overlap in expression. Such differences in expression could be caused by the transgene in the EPIC dataset not recapitulating the profile of the endogenous gene, or missing signals between cells in the blastomere dataset, as is seen from the whole embryo/blastomeres expression level ratio (See Supplementary Table 1, ratios defined as equal, slightly higher/lower or much higher/lower). Expression profile compared to the EPIC dataset deviates more when expression in the blastomeres is low compared to the whole embryo, but the blastomere dataset has the advantage that all genes are assayed simultaneously, no transgenes are used, maternal transcripts are seen, and down-regulation of genes is observable.
Extended Data Figure 3
Extended Data Figure 3. Lineage restricted gene expression identifies genes dependent upon coherence of the lineages and tissue specificity
a, Expression profiles of genes involved in pharynx specification. The left and right panels correspond to the two Notch signaling events. The top and bottom images correspond to the expected regulatory patterns in the whole embryo and isolated blastomeres, respectively. tbx-37 is not shown since it is identical to tbx-38 in expression profile. b, Comparison of the overall sum of expression between the two time-courses, plotted on a log2 scale (black). Genes “missing” in the separated lineage time-course were manually added to the graph at −3. The additional plots indicate the same measure for dynamically expressed genes (blue) and constitutive genes (red). c, Idealized expression profiles used to identify gene expression clusters. d, The gene expression profiles for the temporally restricted gene expression profiles. Each profile was “standardized” by subtracting its mean and dividing by its standard deviation. e, Average expression profiles of ten clusters of dynamically expressed genes determined based upon the whole embryo expression data (see Methods). f, The number of dynamic genes in each temporal period In each group, the genes not expressed in the lineage time-course (b) are marked in red.
Extended Data Figure 4
Extended Data Figure 4. The first principal component correlates with developmental time
Principal components analysis as described in Figure 2a. Color codes are same as in Figure 1. PC1, PC2 and PC3 capture 18%, 12% and 11%, respectively, of the variation in the expression, respectively, in the 1,320 dynamically expressed genes with no expression in the first stage (to exclude genes with maternal expression).
Extended Data Figure 5
Extended Data Figure 5. Germ layer specific expression
Expression profiles of the germ layer specific genes in each of the lineages. The x- and y-axes are the eleven examined temporal stages and individual genes, respectively. Germ layer specific genes were identified by hierarchical clustering based upon correlation among dynamically expressed genes (see Methods).
Extended Data Figure 6
Extended Data Figure 6. Robustness of gene age analysis
a, Same format as Figure 4a but with the definition of old genes as those present in at least 25% of the examined Eukaryotes (see Methods) that are not Ophisthokonts. b, Same as Figure 4a with a definition of “old” as those present in 25% of the examined organisms that are not Eukaryotes (Eubacteria and Archaea).
Extended Data Figure 7
Extended Data Figure 7. Truncated endoderm gene set control
To exclude the possibility that general genes are included as “endoderm-specific” since the endoderm program is induced earlier, we excluded temporal clusters 8, 9, 10 from the endoderm genes and repeated the relevant analyses. We found that there is no dramatic change in the results. The results are shown in the same format as Figure 3 and 4b-c.
Figure 1
Figure 1. Determining the expression profiles of the C. elegans embryonic founder cell lineages
a, Sample collections are indicated for the shown C. elegans blastomere lineages (circles, Extended Data Fig. 1 and Extended Data Table 2) and whole embryos (notches, in minutes). b, Heat map showing Pearson’s correlation coefficients among the transcriptomes of the whole embryo and the sum of the individual blastomere lineages. White circles indicate pairs of blastomere stages and embryonic time-points expected to be most similar (Extended Data Table 2). c, P-values of enrichment across curated lists of genes for the indicated lineage-specific gene expression clusters (Extended Data Table 3 and Extended Data Fig. 2d). The white circles indicate the expected differentiation of each expression cluster (Extended Data Table 1). d, Spatial and temporal gene expression profiles.
Figure 2
Figure 2. Dynamics of germ layer gene expression throughout development
a, PCA on dynamically expressed genes for the five lineage time-courses (See Extended Data Fig. 4 for PC1). Adjacent stages of the same lineage are connected by a line, the terminal stage is indicated by a circle. b, Heat map indicating Pearson’s correlation coefficients between blastomere expression profile of dynamically expressed genes. The right-side bars indicate the time of expression (temporal clusters, as in Extended Data Fig. 3c-e) and the location of expression. c, Summary of location of expression for genes according to temporal clusters.
Figure 3
Figure 3. The endoderm expression program precedes the ectoderm program in diverse species
Expression of germ layer genes in C. elegans, and their orthologs in X. tropicalis, N. vectensis, and A. queenslandica. The average is computed on the maximum-normalized gene profiles.
Figure 4
Figure 4. The germ layers exhibit distinct gene ages and functional category enrichments
a, Fraction of ‘old’ genes – defined as presence of orthologs in other opisthokont Eukaryotes – across the indicated temporal induction clusters and germ layers. Different gene age thresholds show similar results (Extended Data Fig. 6). b, For the shown functional categories, the bars indicate the fraction of genes in the endoderm gene set, ectoderm gene set, and other dynamic and zygotically expressed genes. Asterisks indicate significant endoderm (green) and ectoderm (blue) enrichments (P<0.01, Hypergeometric distribution). c, The fraction of orthologs in M. brevicollis is indicated for each functional category. d, A model for germ layer evolution.

References

    1. Hall BK. Evolutionary developmental biology. 2nd ed. Chapman & Hall; 1998.
    1. Wolpert L. Principles of development. 4th ed. Oxford University Press; 2011.
    1. Technau U, Scholz CB. Origin and evolution of endoderm and mesoderm. Int J Dev Biol. 2003;47:531–539. - PubMed
    1. Ryan JF, et al. The genome of the ctenophore Mnemiopsis leidyi and its implications for cell type evolution. Science. 2013;342:1242592. - PMC - PubMed
    1. Martindale MQ, Pang K, Finnerty JR. Investigating the origins of triploblasty: ‘mesodermal’ gene expression in a diploblastic animal, the sea anemone Nematostella vectensis (phylum, Cnidaria; class, Anthozoa) Development. 2004;131:2463–2474. - PubMed

Publication types

MeSH terms

Associated data