

Modeling tools for dengue risk mapping - a systematic review
- PMID: 25487167
- PMCID: PMC4273492
- DOI: 10.1186/1476-072X-13-50
Modeling tools for dengue risk mapping - a systematic review
Abstract
Introduction: The global spread and the increased frequency and magnitude of epidemic dengue in the last 50 years underscore the urgent need for effective tools for surveillance, prevention, and control. This review aims at providing a systematic overview of what predictors are critical and which spatial and spatio-temporal modeling approaches are useful in generating risk maps for dengue.
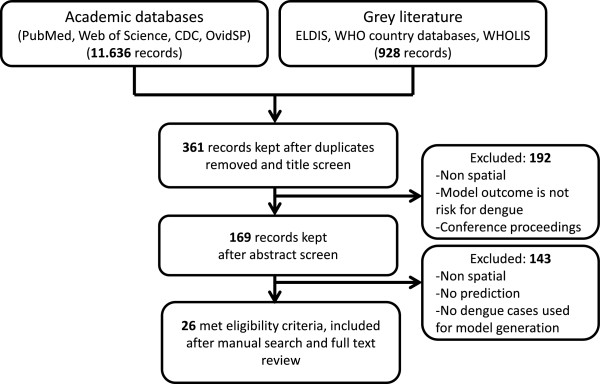
Methods: A systematic search was undertaken, using the PubMed, Web of Science, WHOLIS, Centers for Disease Control and Prevention (CDC) and OvidSP databases for published citations, without language or time restrictions. A manual search of the titles and abstracts was carried out using predefined criteria, notably the inclusion of dengue cases. Data were extracted for pre-identified variables, including the type of predictors and the type of modeling approach used for risk mapping.
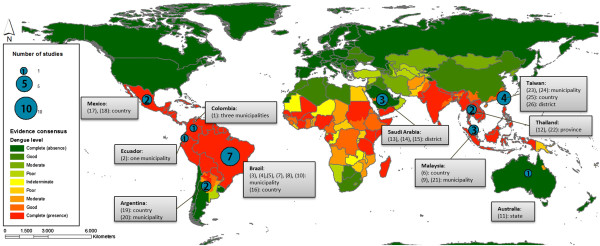
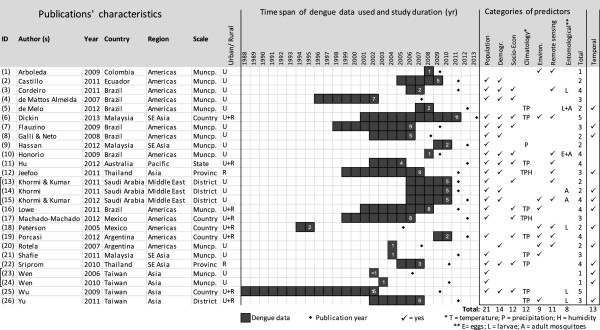
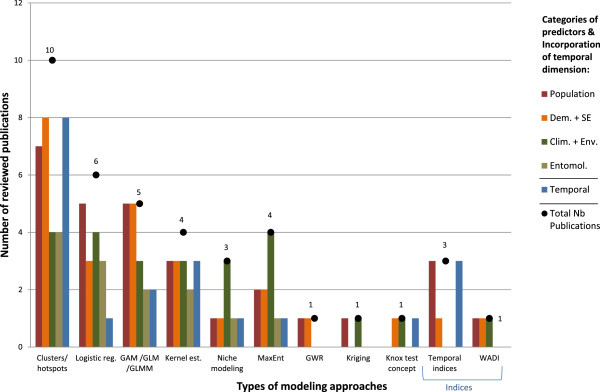
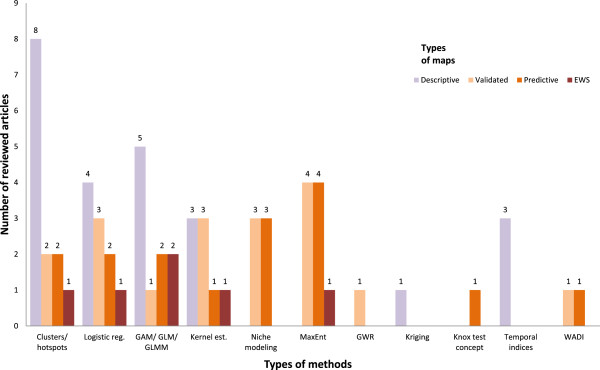
Results: A wide variety of both predictors and modeling approaches was used to create dengue risk maps. No specific patterns could be identified in the combination of predictors or models across studies. The most important and commonly used predictors for the category of demographic and socio-economic variables were age, gender, education, housing conditions and level of income. Among environmental variables, precipitation and air temperature were often significant predictors. Remote sensing provided a source of varied land cover data that could act as a proxy for other predictor categories. Descriptive maps showing dengue case hotspots were useful for identifying high-risk areas. Predictive maps based on more complex methodology facilitated advanced data analysis and visualization, but their applicability in public health contexts remains to be established.
Conclusions: The majority of available dengue risk maps was descriptive and based on retrospective data. Availability of resources, feasibility of acquisition, quality of data, alongside available technical expertise, determines the accuracy of dengue risk maps and their applicability to the field of public health. A large number of unknowns, including effective entomological predictors, genetic diversity of circulating viruses, population serological profile, and human mobility, continue to pose challenges and to limit the ability to produce accurate and effective risk maps, and fail to support the development of early warning systems.
Figures
References
-
- WHO: Dengue and severe dengue. http://www.who.int/mediacentre/factsheets/fs117/en/
-
- Cattand P, Desjeux P, Guzmán MG, Jannin J, Kroeger A, Medici A, Musgrove P, Nathan MB, Shaw A, Schofield CJ. Tropical Diseases Lacking Adequate Control Measures: Dengue, Leishmaniasis, and African Trypanosomiasis. In: Jamison DT, Breman JG, Measham AR, Alleyne G, Claeson M, Evans DB, Jha P, Mills A, Musgrove P, editors. Disease Control Priorities in Developing Countries. 2. Washington (DC): World Bank; 2006. - PubMed
Publication types
MeSH terms
LinkOut - more resources
Full Text Sources
Other Literature Sources
Medical
