. 2015 Jan;17(1):57-67.
doi: 10.1038/ncb3075. Epub 2014 Dec 8.

White-to-brown metabolic conversion of human adipocytes by JAK inhibition

Affiliations

White-to-brown metabolic conversion of human adipocytes by JAK inhibition

Annie Moisan et al. Nat Cell Biol. 2015 Jan.

Abstract

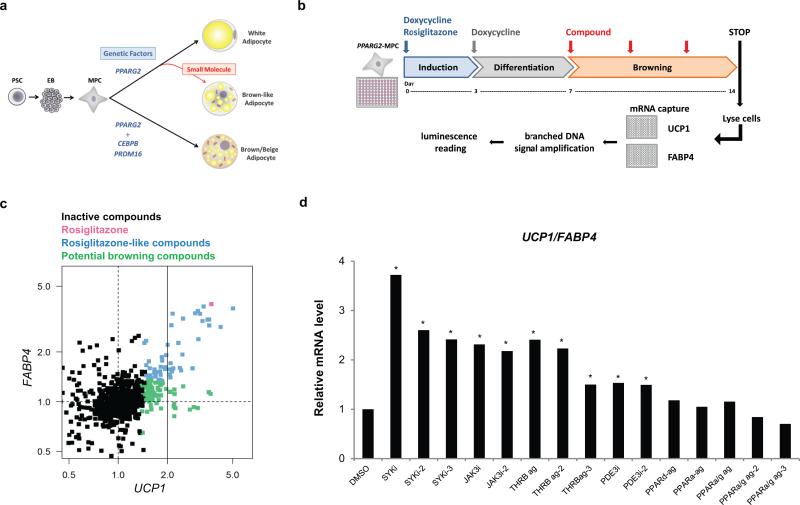
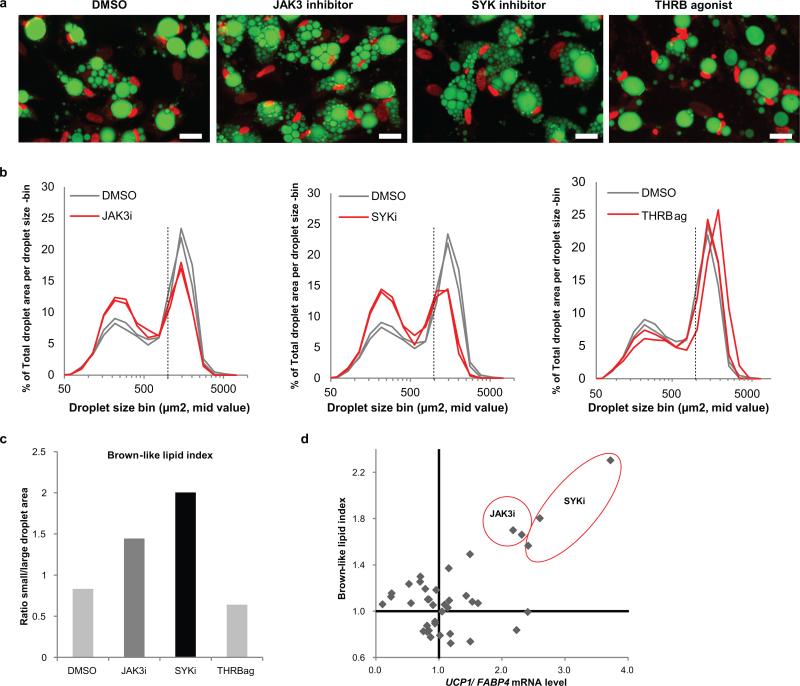
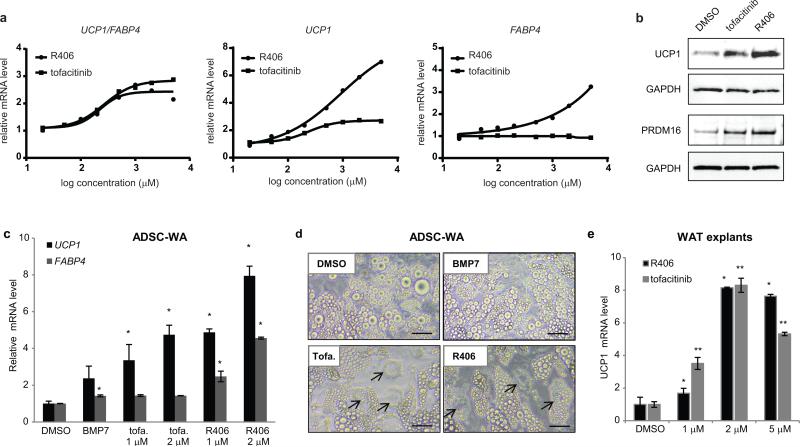
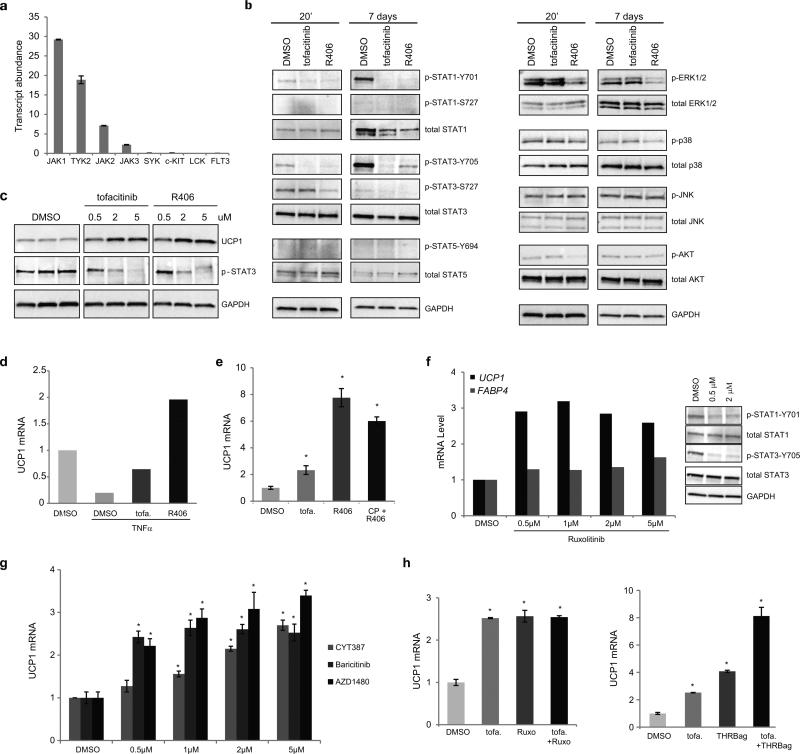
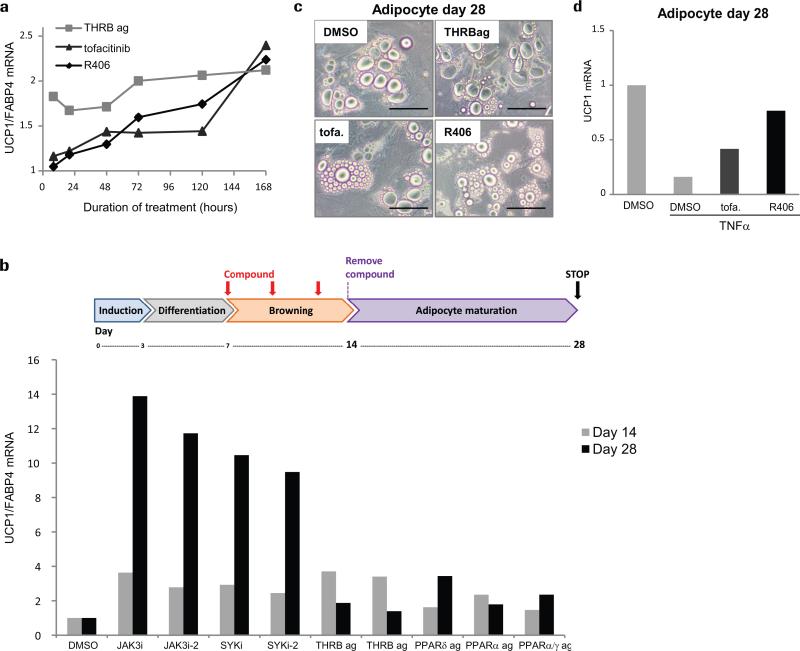
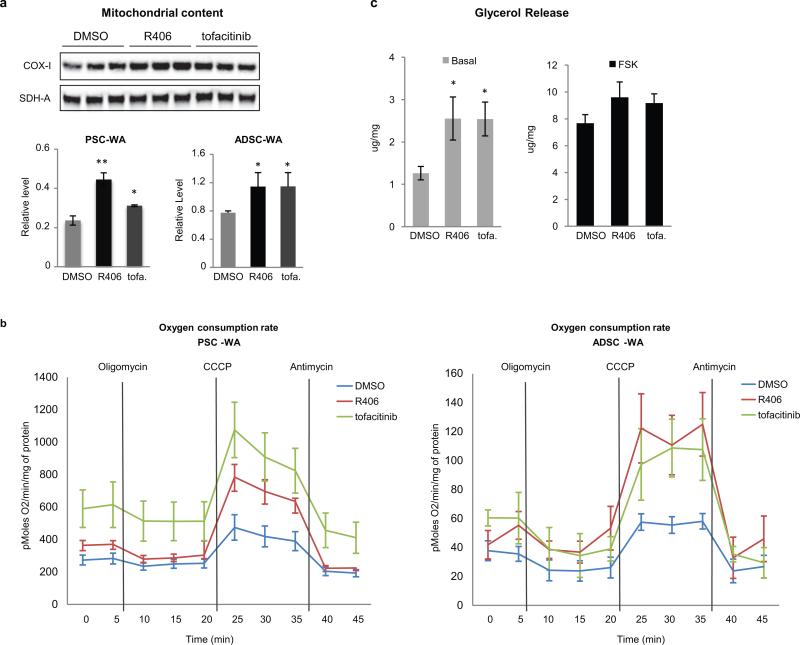
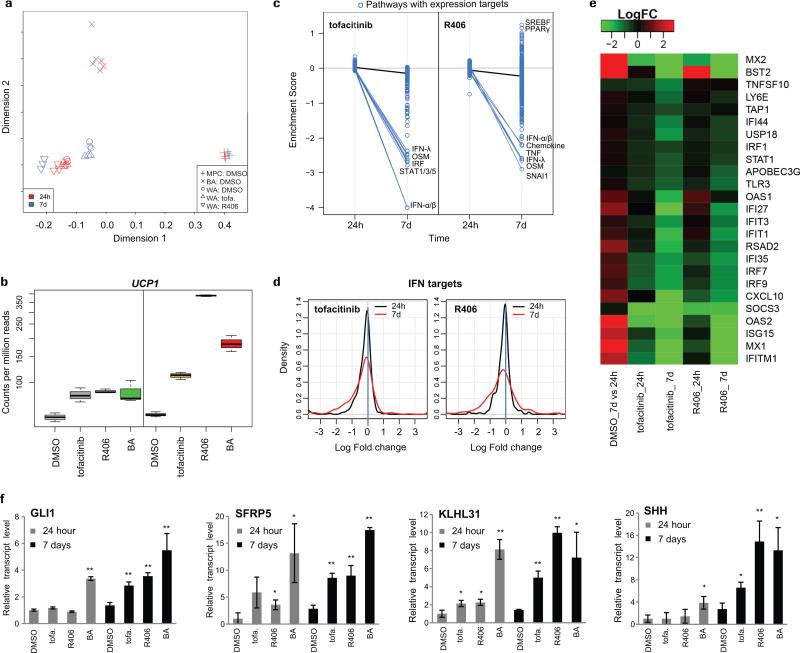
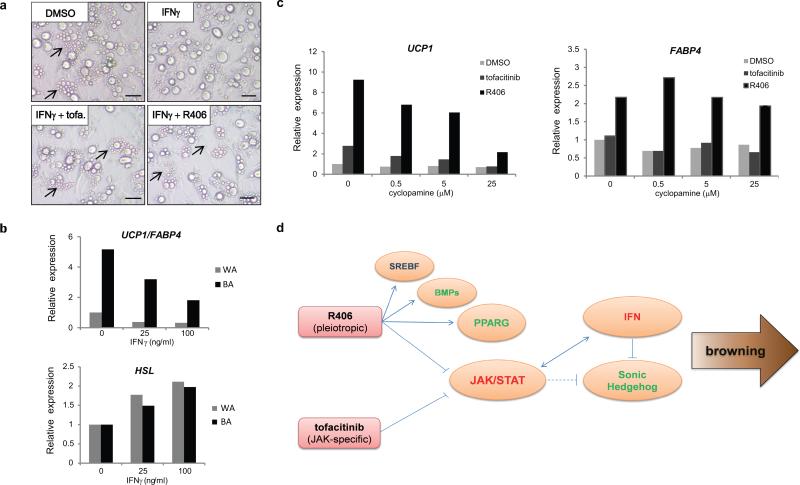
The rising incidence of obesity and related disorders such as diabetes and heart disease has focused considerable attention on the discovery of new therapeutics. One promising approach has been to increase the number or activity of brown-like adipocytes in white adipose depots, as this has been shown to prevent diet-induced obesity and reduce the incidence and severity of type 2 diabetes. Thus, the conversion of fat-storing cells into metabolically active thermogenic cells has become an appealing therapeutic strategy to combat obesity. Here, we report a screening platform for the identification of small molecules capable of promoting a white-to-brown metabolic conversion in human adipocytes. We identified two inhibitors of Janus kinase (JAK) activity with no precedent in adipose tissue biology that stably confer brown-like metabolic activity to white adipocytes. Importantly, these metabolically converted adipocytes exhibit elevated UCP1 expression and increased mitochondrial activity. We further found that repression of interferon signalling and activation of hedgehog signalling in JAK-inactivated adipocytes contributes to the metabolic conversion observed in these cells. Our findings highlight a previously unknown role for the JAK-STAT pathway in the control of adipocyte function and establish a platform to identify compounds for the treatment of obesity.


Figures

Figure 1
Figure 1. Browning screen in human stem cell-derived adipocytes
a) Conceptual strategy to identify small molecules with adipocyte browning effect using human stem cells. PSC: pluripotent stem cells, EB: embryoid bodies, MPC: mesenchymal progenitor cells. b) Adipocyte browning screen, assay workflow. PPARG2 expressing-MPC (PPARG2-MPC) were maintained in adipogenic medium containing doxycycline and rosiglitazone for 3 days in order to induce adipogenesis, and differentiated in the absence of rosiglitazone for 4 days. A library of 867 compounds of known mode of action was applied to PSC-WA at day 7, 10 and 12. Total mRNA was collected at day 14, and UCP1 and FABP4 mRNA levels were quantified using the branched DNA technology. PPARG2-MPC: mesenchymal progenitor cells transduced with rtTA and doxycycline-inducible PPARG2 expression vectors. For more details see the methods section. c) Scatter plot display of browning screen results. Each data point represents the average of two biological replicates per compound, normalized on DMSO control. X axis: UCP1 mRNA level as an indicator of adipocyte browning, Y axis: FABP4 mRNA as an indicator of general adipogenesis. The color code distinguishes inactive compounds (black) from active ones: Rosiglitazone (red), Rosiglitazone-like compounds that increase UCP1 and FABP4 (blue), and potential browning compounds that induce UCP1 specifically (green). Dashed lines indicate neutral conditions, solid line delineates UCP1 induction above 2 fold. d) Validation of browning hits by bDNA analysis showing that JAK3 inhibitors, SYK inhibitors and THRB agonists scored as best UCP1/FABP4 inducers. All compounds were added at a 5 μM final concentration. X axis: Compounds are identified by target and mode of action. i= inhibitor, ag = agonist. For chemical nomenclature see the methods section. Values represent the mean of two biological replicates.
Figure 2
Figure 2. Selected compounds modulate lipid morphology
a) PSC-WA were differentiated and treated as described in Fig1B. At day 14, cells were fixed, stained and imaged by confocal microscopy. Green: lipids, Red: nuclei. Scale bars, 50μm. Images are representative of n =3 biological replicates. b) Quantification of changes in lipid morphology is depicted as fraction of total lipid area (Y axis) per lipid droplet size (X axis). JAK3 inhibitor, SYK inhibitor and THRB agonist-treated cells are shown in red and DMSO in gray. Values represent the mean of two biological replicates. c) Bar graph illustrating the quantification of a brown-like lipid index, determined by calculating the ratio of total area for small (<1070μm2) versus large (>1070μm2) lipid droplets for the graphs in b), normalized to the DMSO control sample. Values represent the mean of two biological replicates. d) Scatter plot showing the relation between UCP1/FABP4 mRNA (X axis) and brown-like lipid morphology (Y axis) upon treatment with 39 selected compounds. Brown-like lipid index refers to the ratio of small/large lipid droplets normalized on DMSO as determined in b). Values represent the mean of two biological replicates.
Figure 3
Figure 3. Validation of tofacitinib and R406 browning compounds in primary adipocytes
a) bDNA analysis of dose response with tofacitinib and R406. At high doses, R406 increases both UCP1 and FABP4 expression but UCP1/FABP4 remains above 2. Values represent the mean of two biological replicates. b) Western blot analysis showing that up-regulation of UCP1 and PRDM16 protein levels correlates with up-regulation of UCP1 mRNA by tofacitinib and R406. c) bDNA analysis showing that tofacitinib (tofa.) and R406 increase UCP1 expression in human primary adipocytes. ADSC: Adipose tissue-derived stromal cells. Values are mean ± s.d. of n = three biological replicates and differences from DMSO are significant for * P < 0.05. P values were calculated using the two-tailed paired Student's t-test. d) Bright field images showing that tofacitinib (tofa.) and R406 induce brown-like lipid morphology (arrows) in human primary adipocytes more prominently than BMP7. ADSC: Adipose tissue-derived stromal cells. Scale bars, 20μm. Data representative of 3 independent experiments. For uncropped images see Supplementary Figure 3. e) RT-PCR analysis of UCP1 gene expression in mouse subcutaneous white adipose tissue (WAT) explants following 7 days of treatment with the indicated compound. Values are mean ± S.E.M. of n = three biological replicates of pooled tissue from 5 mice and differences from DMSO are significant for * P < 0.05 and ** P < 0.005. P values were calculated using the two-tailed paired Student's t-test.
Figure 4
Figure 4. Inhibition of STAT phosphorylation downstream of tofacitinib and R406
a) Transcript abundance in RPKM (reads per kilobase transcript per million reads) of known targets of tofacitinib and R406 indicating that the JAK kinases are predominantly represented in PSC-WA. Values are mean ± s.d. of n = three biological replicates. b) Western blot analyses of STATs, AKT and MAPKs in PSC-WA previously treated with DMSO, tofacitinib and R406 for 20 minutes or 7 days showing a pronounced inhibition of STAT phosphorylation by tofacitinib and R406 at both time points. R406 also significantly decreased phosphorylation levels of AKT and ERK1/2. The data shown is representative of two independent experiments. c) Western blot analysis of a dose-response with tofacitinib and R406 showing the correlation between UCP1 accumulation and inhibition of STAT3 phosphorylation. The data shown is representative of two independent experiments. e) bDNA analysis of PSC-WA differentiated as in figure 1b) and treated with TNFα at day 12, indicating that the negative effect of TNFα on UCP1 expression is rescued by tofacitinib and R406. Values represent the mean of two biological replicates. f) Tofacitinib (tofa.) and R406 do not synergize during adipocyte browning. PSC-WA were treated with tofacitinib, R406 or a combination of both and analyzed for UCP1 expression by bDNA. Values are mean ± s.d. of n = three biological replicates and differences from DMSO are significant for * P < 0.05. P values were calculated using the two-tailed paired Student's t-test. d) The JAK 1/2 inhibitor Ruxolitinib positively modulates UCP1 expression (graph) and inhibits STAT1/3 phosphorylation (right panels) in PSC-WA. Graph values of bDNA analysis represent the mean of two biological replicates. Images of western blot analysis are representative of two independent experiments. g) bDNA analysis showing that the JAK1/2 inhibitors CYT387, AZD1480 and Baricitinib positively regulate UCP1 expression in PSC-WA. Values are mean ± s.d. of n = three biological replicates and differences from DMSO are significant for * P < 0.005. P values were calculated using the two-tailed paired Student's t-test. h) Tofacitinib (tofa.) synergizes with THRB agonist (right panel) but not with Ruxolitinib (Ruxo., left panel) during adipocyte browning. Values are mean ± s.d. of n = three biological replicates and differences from DMSO are significant for * P < 0.005. P values were calculated using the two-tailed paired Student's t-test.
Figure 5
Figure 5. JAK inhibition stably induces a brown-like profile in adipocytes
a) bDNA quantification of UCP1 mRNA levels over time, showing that the progressive accumulation of UCP1 induced by tofacitinib and R406 contrasts with the acute effect of THRB agonists. Values represent the mean of two biological replicates. b) Schematic illustration of experimental design for b), c), and d): PSC-WA were treated with compounds for 7 days, washed 3 times with compound-free medium, and maintained in compound-free medium for an additional 14 day-period. Images were captured at day 28 prior to addition of lysis buffer and bDNA analysis. Only JAK3i and SYKi-pre-treated cells displayed high levels of UCP1 mRNA relative to DMSO. Values represent the mean of two biological replicates. c) Bright field images showing a reduced lipid vacuole size at day 28 for tofacitinib (tofa.) and R406-pre-treated adipocytes. Scale bars, 50μm. Images are representative of two independent experiments. d) DMSO, tofacitinib (tofa.) and R406-pre-treated adipocytes were exposed to TNFα from day 26 to 28. bDNA analysis shows that pre-treatment with tofacitinib and R406 protects adipocytes from TNFα-mediated down-regulation of UCP1 expression. Values represent the mean of two biological replicates.
Figure 6
Figure 6. JAK inhibition induces brown-like metabolic properties in adipocytes
a) Mitochondrial content was assessed by determining the ratio of COX-I on SDH-A protein levels by immunoblots as shown in upper panel for PSC-WA. Quantification of immunoblots revealed up-regulation of mitochondrial content in tofacitinib and R406-treated PSC-WA and ADSC adipocytes. Values are mean ± s.e.m. of n = three biological replicates and differences from DMSO are significant for * P < 0.05 and ** P < 0.01. P values were calculated using the two-tailed paired Student's t-test. b) Tofacitinib and R406-treated PSC-WA and ADSC adipocytes have higher oxygen consumption rate (OCR) compare to DMSO-treated adipocytes. Values are mean ± s.e.m. of n = four (DMSO and tofacitinib) and n = three (R406) biological replicates. c) The degree of lipolytic activity was assessed by quantification of glycerol release. tofacitinib (tofa.) and R406-treated ADSC adipocytes showed increased lipolysis in the basal state (upper graph), but no in Forskolin (FSK)-stimulated cells (lower graph. Values are mean ± s.e.m. of n = three biological replicates and differences from DMSO are significant for * P < 0.05. P values were calculated using the two-tailed paired Student's t-test.
Figure 7
Figure 7. Gene signature and cellular identity of JAK-inactivated adipocytes
a-f) Adipocytes were differentiated according to scheme 1B, treated with tofacitinib and R406 at day 7, and collected at day 8 (24h time point) or day 14 (d7 time point). N= 3 biological replicates. Each independent biological replicate was pooled from two individual wells. a) Multi-dimensional scaling of RNA sequencing data revealing the white lineage identity of tofacitinib (tofa.) and R406 treated PSC-WA. b) Levels of UCP1 transcripts served as experimental control for adipocyte browning. UCP1 transcripts are higher in BA versus WA and higher in tofacitinib (tofa.) and R406-treated PSC-WA compare to DMSO-treated PSC-WA. c) Interferon targets and pro-inflammatory pathways are significantly down-regulated by both compounds at 7d in PSC-WA. Enrichment scores of 9116 gene sets are compared between two time points (24h and 7d) for both compounds. Each circle represents one gene set that is coherently regulated by an upstream pathway. Black lines indicate the change of average scores, and blue lines the change of individual pathways that are significantly reduced (|ΔES|>=2). d) Differential expression profiles of interferon targets induced by tofacitinib and R406. A substantial subset of target genes are negatively regulated in both cases, making the density curves of logFC shifts toward left and thereby forming a “red shoulder”. Compared with 24h, the expression of interferon pathway targets are repressed by both compounds at 7d (P =2.94E-6 and 2.06E-5, respectively; one-sided Kolmogorov-Smirnov test). e) Differential expression profiles of selected interferon target genes in heatmap. f) Whole transcriptome analysis revealed that the sonic hedgehog responsive genes GLI1, SFRP5, KLHL31 and SHH were up-regulated in tofacitinib (tofa.) and R406-treated adipocytes at day 7 compare to DMSO control. Values are mean ± s.d. of n = three biological replicates and differences from DMSO are significant for * P < 0.05 and ** P < 0.01. P values were calculated using the two-tailed paired Student's t-test.
Figure 8
Figure 8. IFN and SHH signaling contribute to adipocyte browning downstream of JAK inhibition
a) Whitening of IFNγ-treated adipocytes is visible as lipid accumulation forms a single, large vacuole. Treatment with tofacitinib (tofa.) and R406 restores the formation of small lipid droplets (arrows). Bright field images representative of two independent experiments. Scale bars, 20μm. b) IFNγ treatment decreases the UCP1/FABP4 ratio (upper graph) and increases the expression of HSL, a marker of white adipocyte (lower graph) both in WA and BA. Values represent the mean of two biological replicates. c) The SHH pathway antagonist cyclopamine fully blocks CP-6990550-mediated browning as judged by UCP1 level and partially blocks SYKi-mediated browning (left graph). Cyclopamine didn't restore R406-induced FABP4 levels, thereby decoupling the regulation of UCP1 and FABP4 by R406 (right graph). Values represent the mean of two biological replicates. d) Model of adipocyte browning by pharmacological inhibition of JAK. Tofacitinib and R406 inhibit the JAK-STAT pathway in human adipocytes, leading to down-regulation of the interferon alpha, beta and gamma responses. Sustained shut down of IFN signaling relieves inhibition of the sonic hedgehog (SHH) pathway and thereby contributes to accumulation of UCP1. R406 acts as a pleiotropic drug with broad effects on adipocytes through activation of PPARG, BMPs and SREBF target genes. Red fonts: negative regulator of browning; Green fonts: positive regulator of browning; Arrows: activation; Flat lines: inhibition; Dash lines: hypothetical.

References

    1. Bartelt A, et al. Brown adipose tissue activity controls triglyceride clearance. Nature medicine. 2011;17:200–205. - PubMed
    1. Stanford KI, et al. Brown adipose tissue regulates glucose homeostasis and insulin sensitivity. The Journal of clinical investigation. 2013;123:215–223. - PMC - PubMed
    1. Cypess AM, et al. Identification and importance of brown adipose tissue in adult humans. The New England journal of medicine. 2009;360:1509–1517. - PMC - PubMed
    1. Ghorbani M, Himms-Hagen J. Appearance of brown adipocytes in white adipose tissue during CL 316,243-induced reversal of obesity and diabetes in Zucker fa/fa rats. International journal of obesity and related metabolic disorders : journal of the International Association for the Study of Obesity. 1997;21:465–475. - PubMed
    1. Granneman JG, Li P, Zhu Z, Lu Y. Metabolic and cellular plasticity in white adipose tissue I: effects of beta3-adrenergic receptor activation. American journal of physiology. Endocrinology and metabolism. 2005;289:E608–616. - PubMed

Publication types

MeSH terms

Substances

Associated data